goreport, goreport, goreport, goreport, goreport, goreport, goreport, goreport, goreport,
goreport, goreport, goreport, goreport, goreport, goreport,

Introduction
GoReport is a UK software provider to the property sector, giving surveyors, facilities managers and asset managers a single platform to capture site data on mobile and turn it into standards-aligned reports, including RICS-aligned templates and Planned Preventative Maintenance surveys.
Customers previously received portfolio-level reporting through a bespoke Power BI build, produced manually for every dashboard - consistent enough for board presentation, but slow to create and something GoReport’s own team could not adapt themselves for a new client or template.

Starting from an existing prototype GoReport had already validated, we scoped the production build as a standalone six-week v1, with platform integration only committed to once the results justified it.
Solution


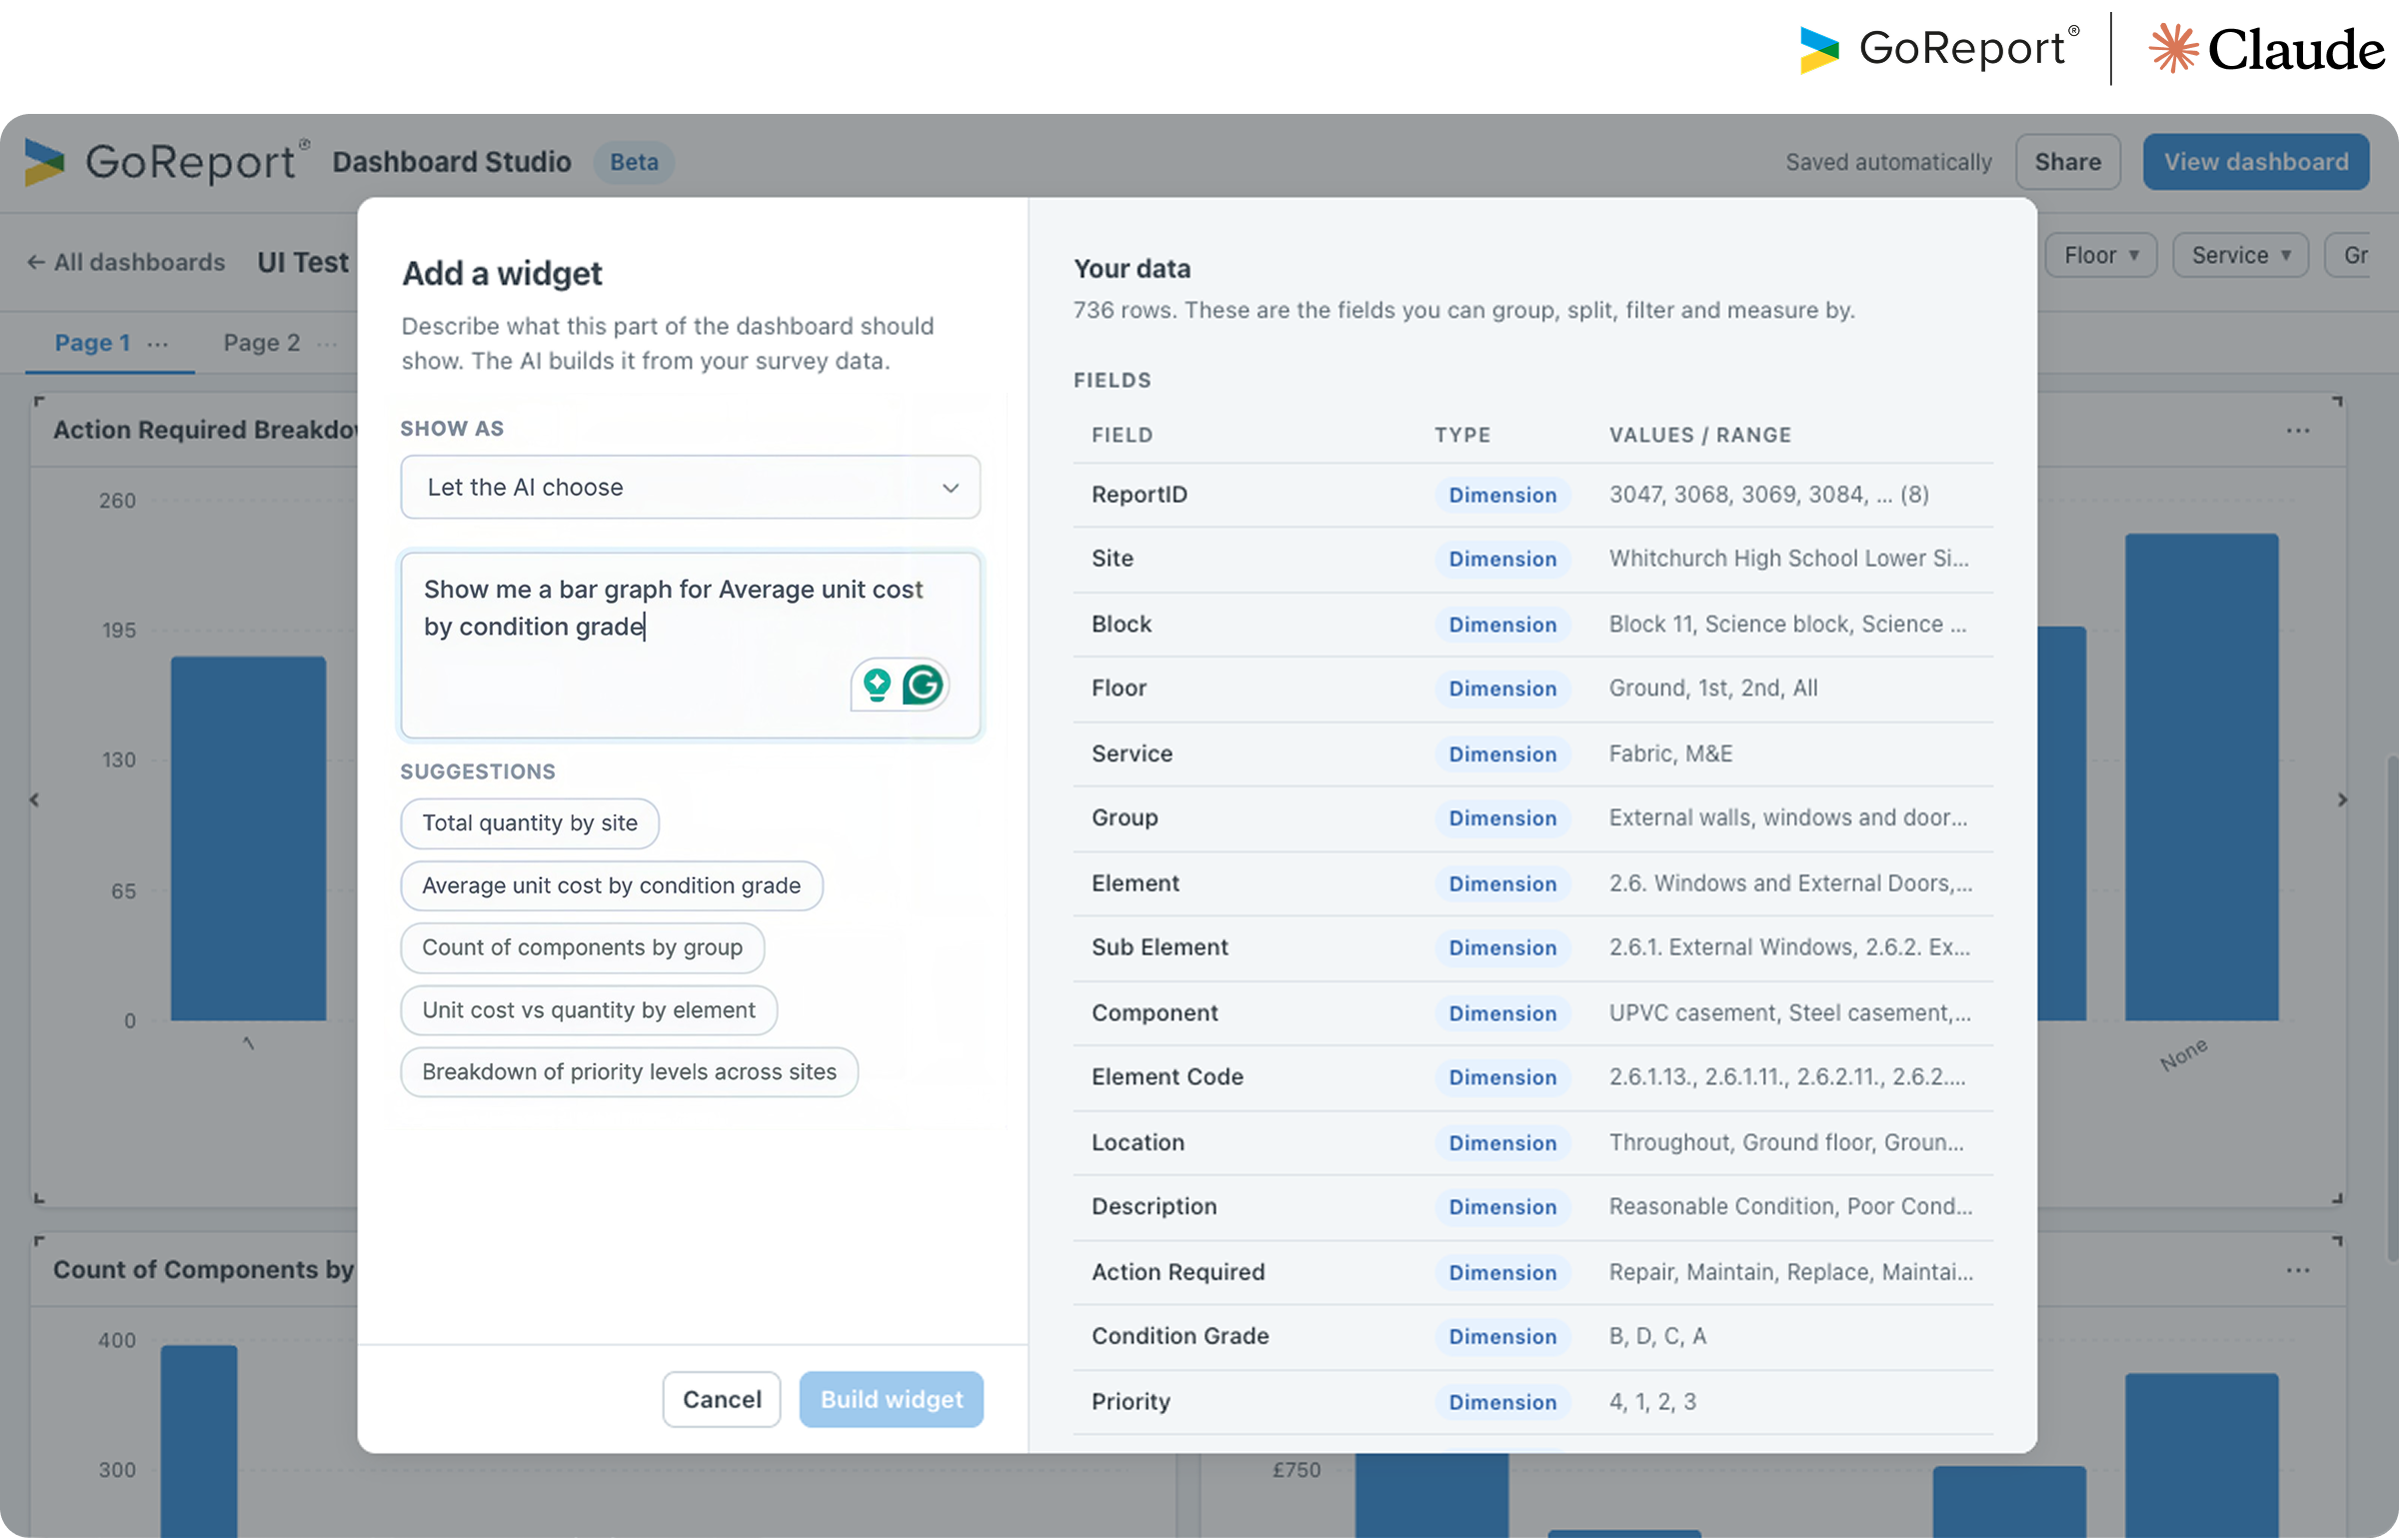
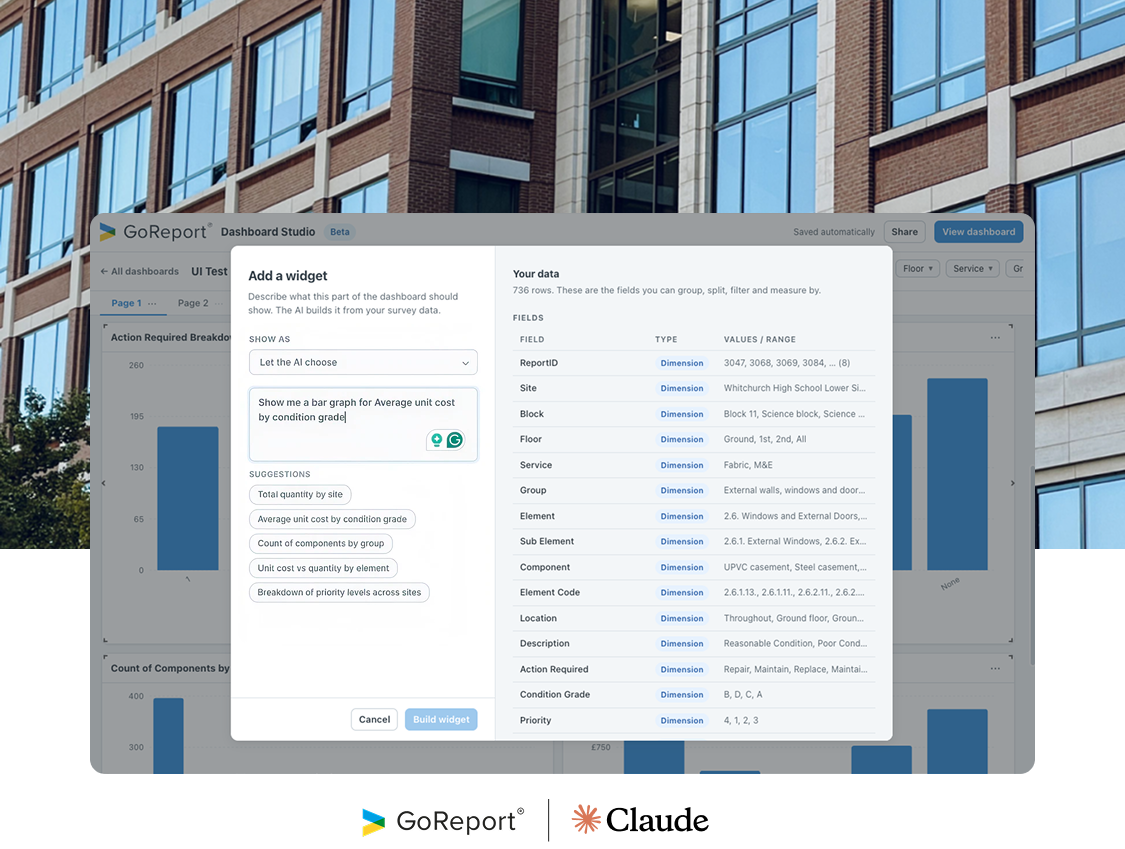
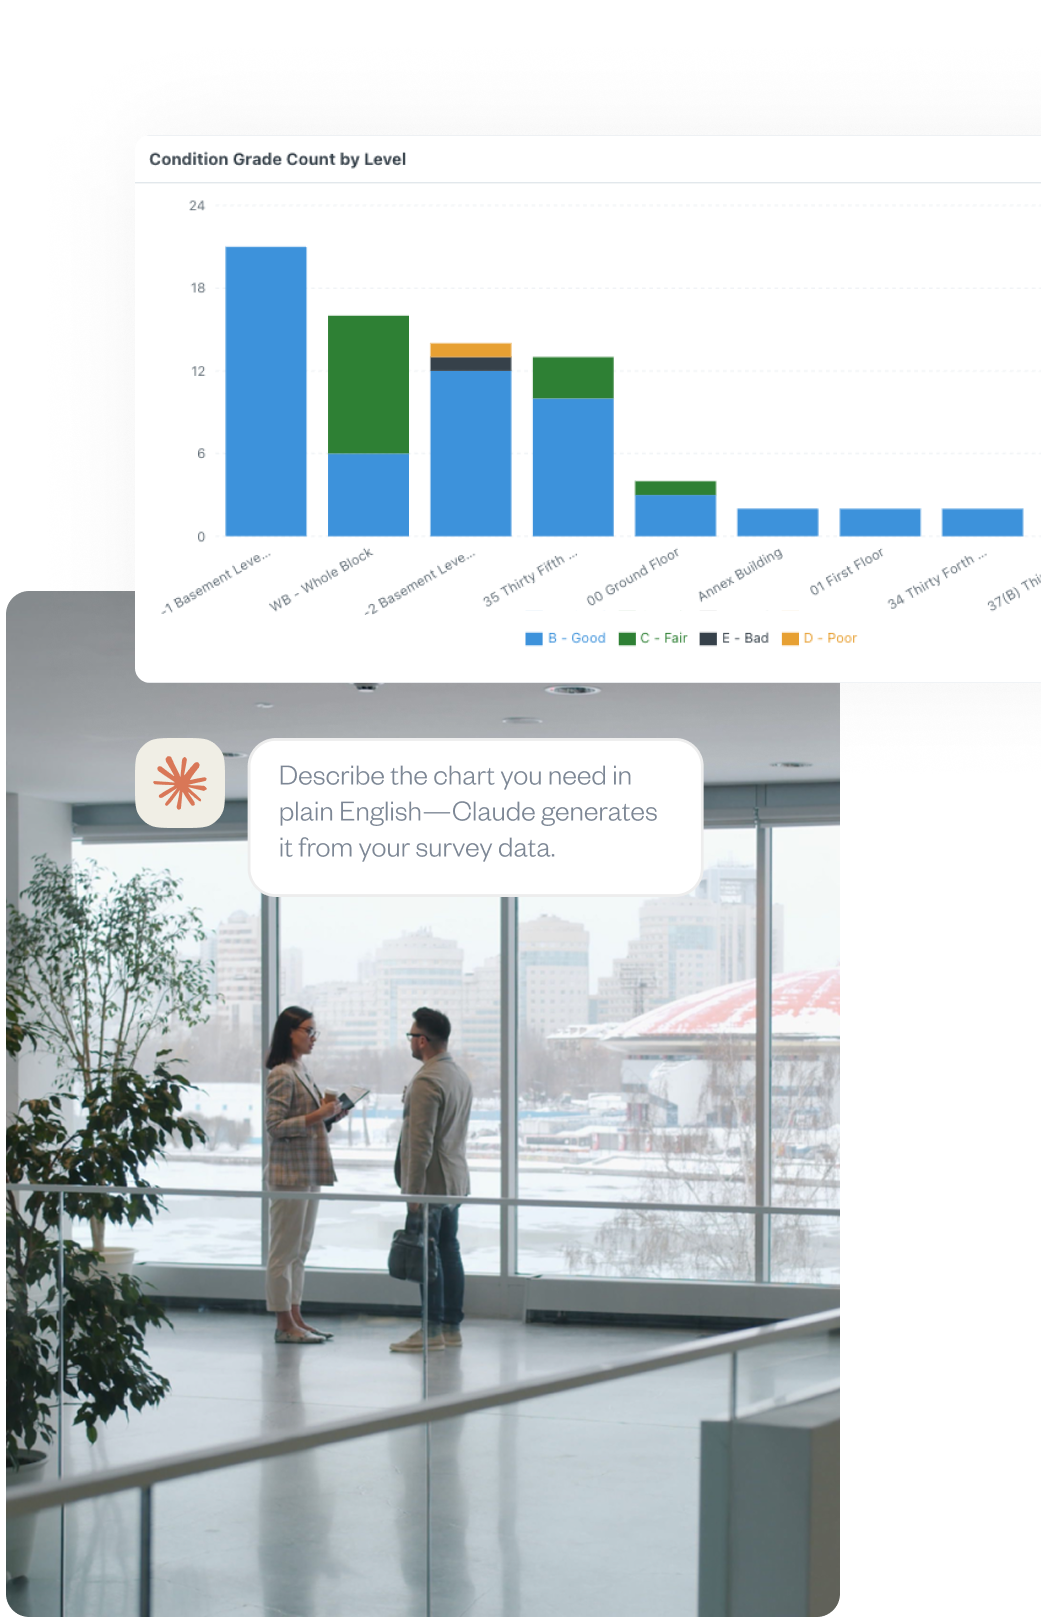
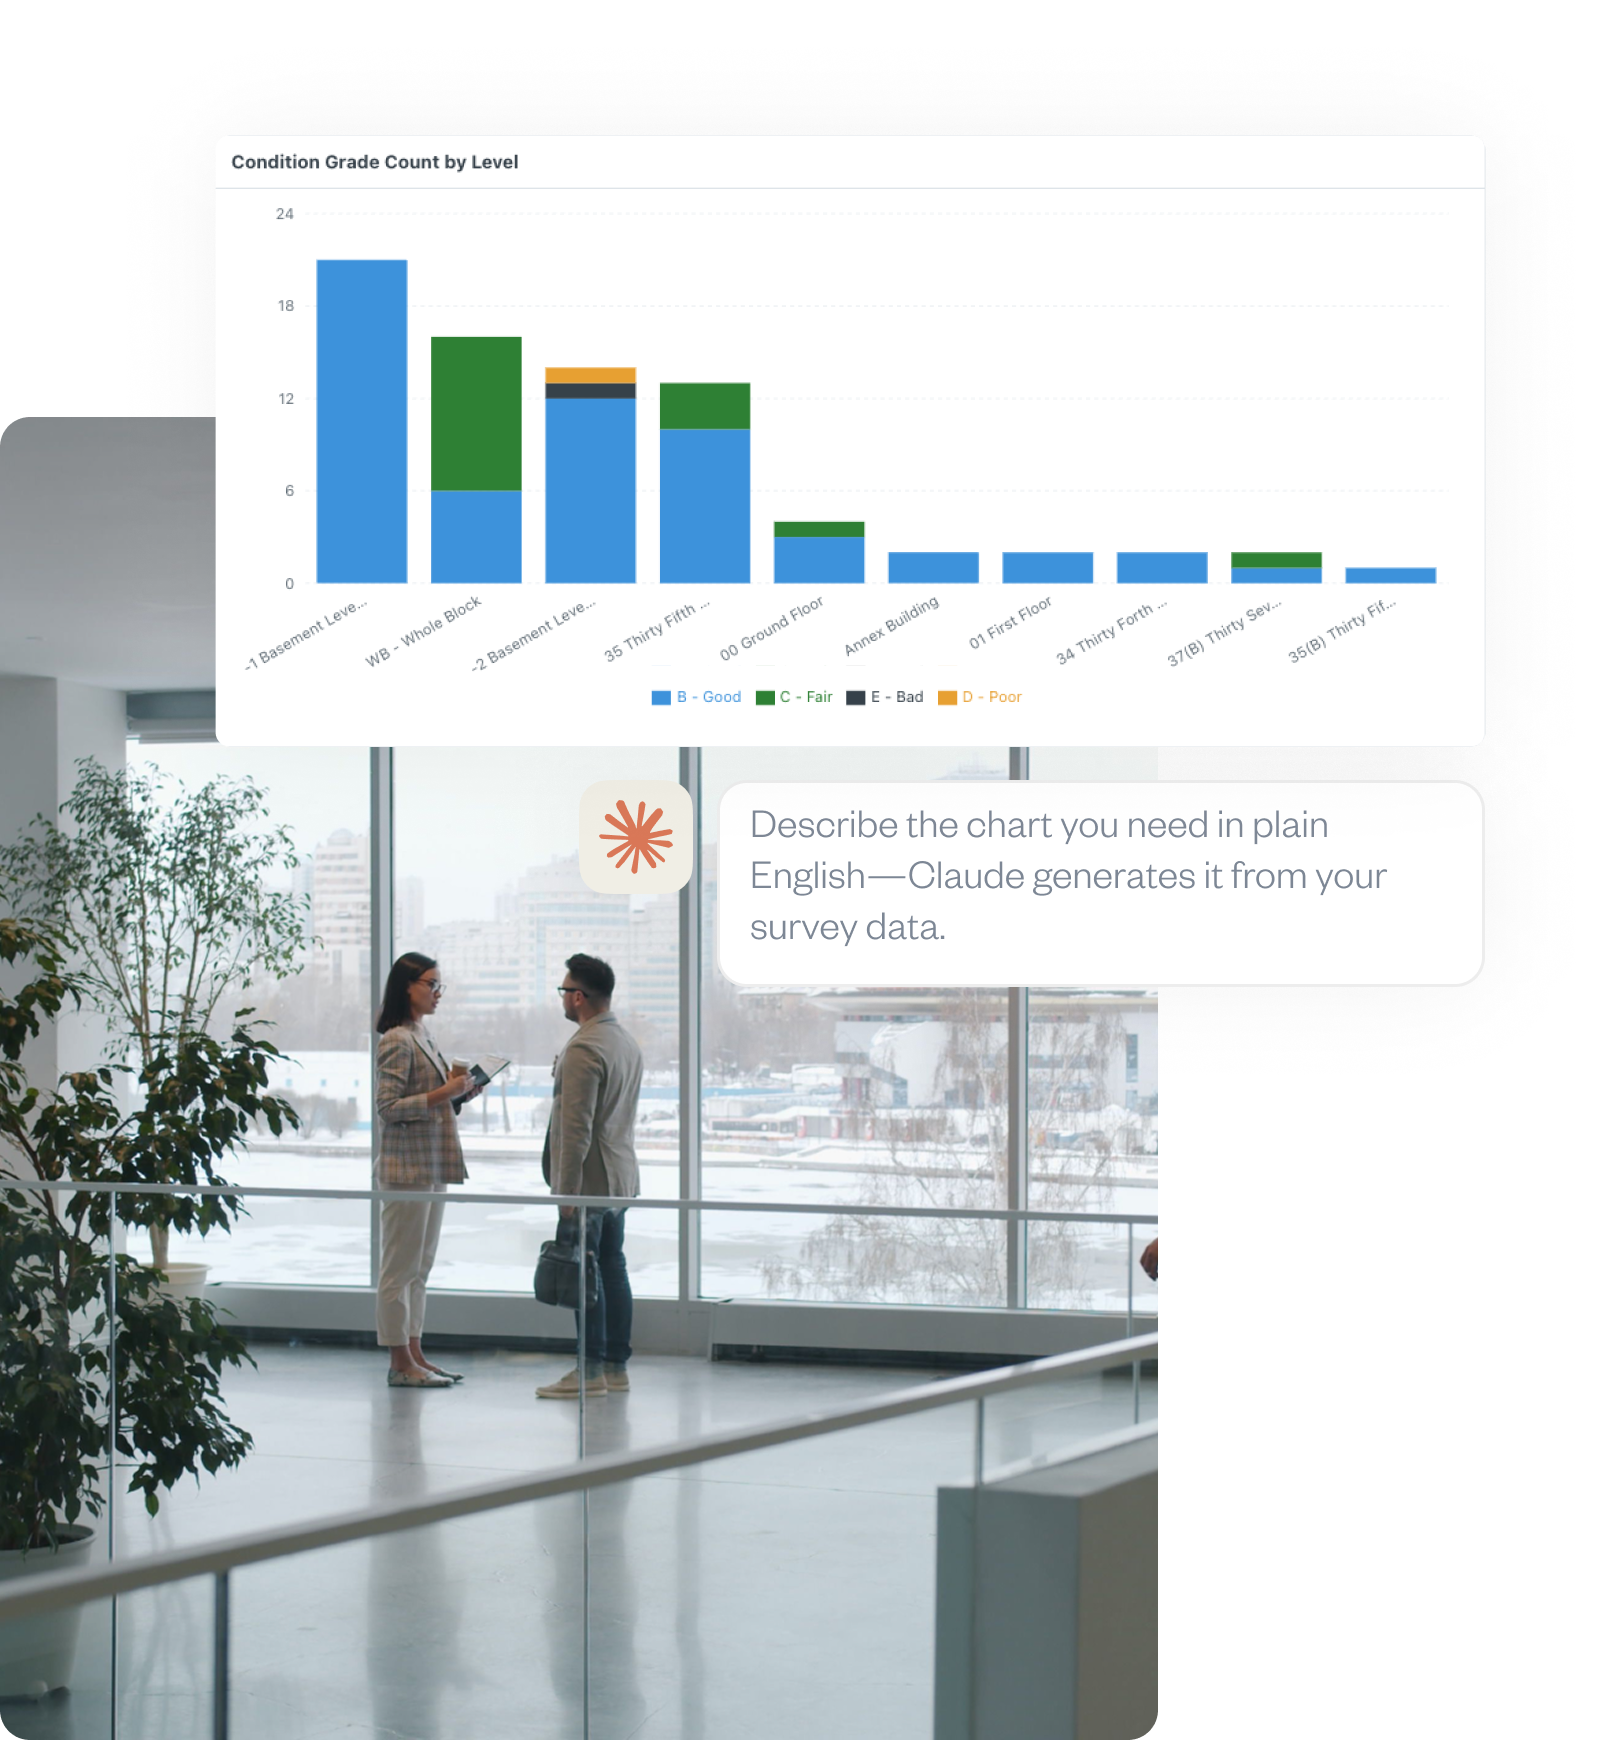
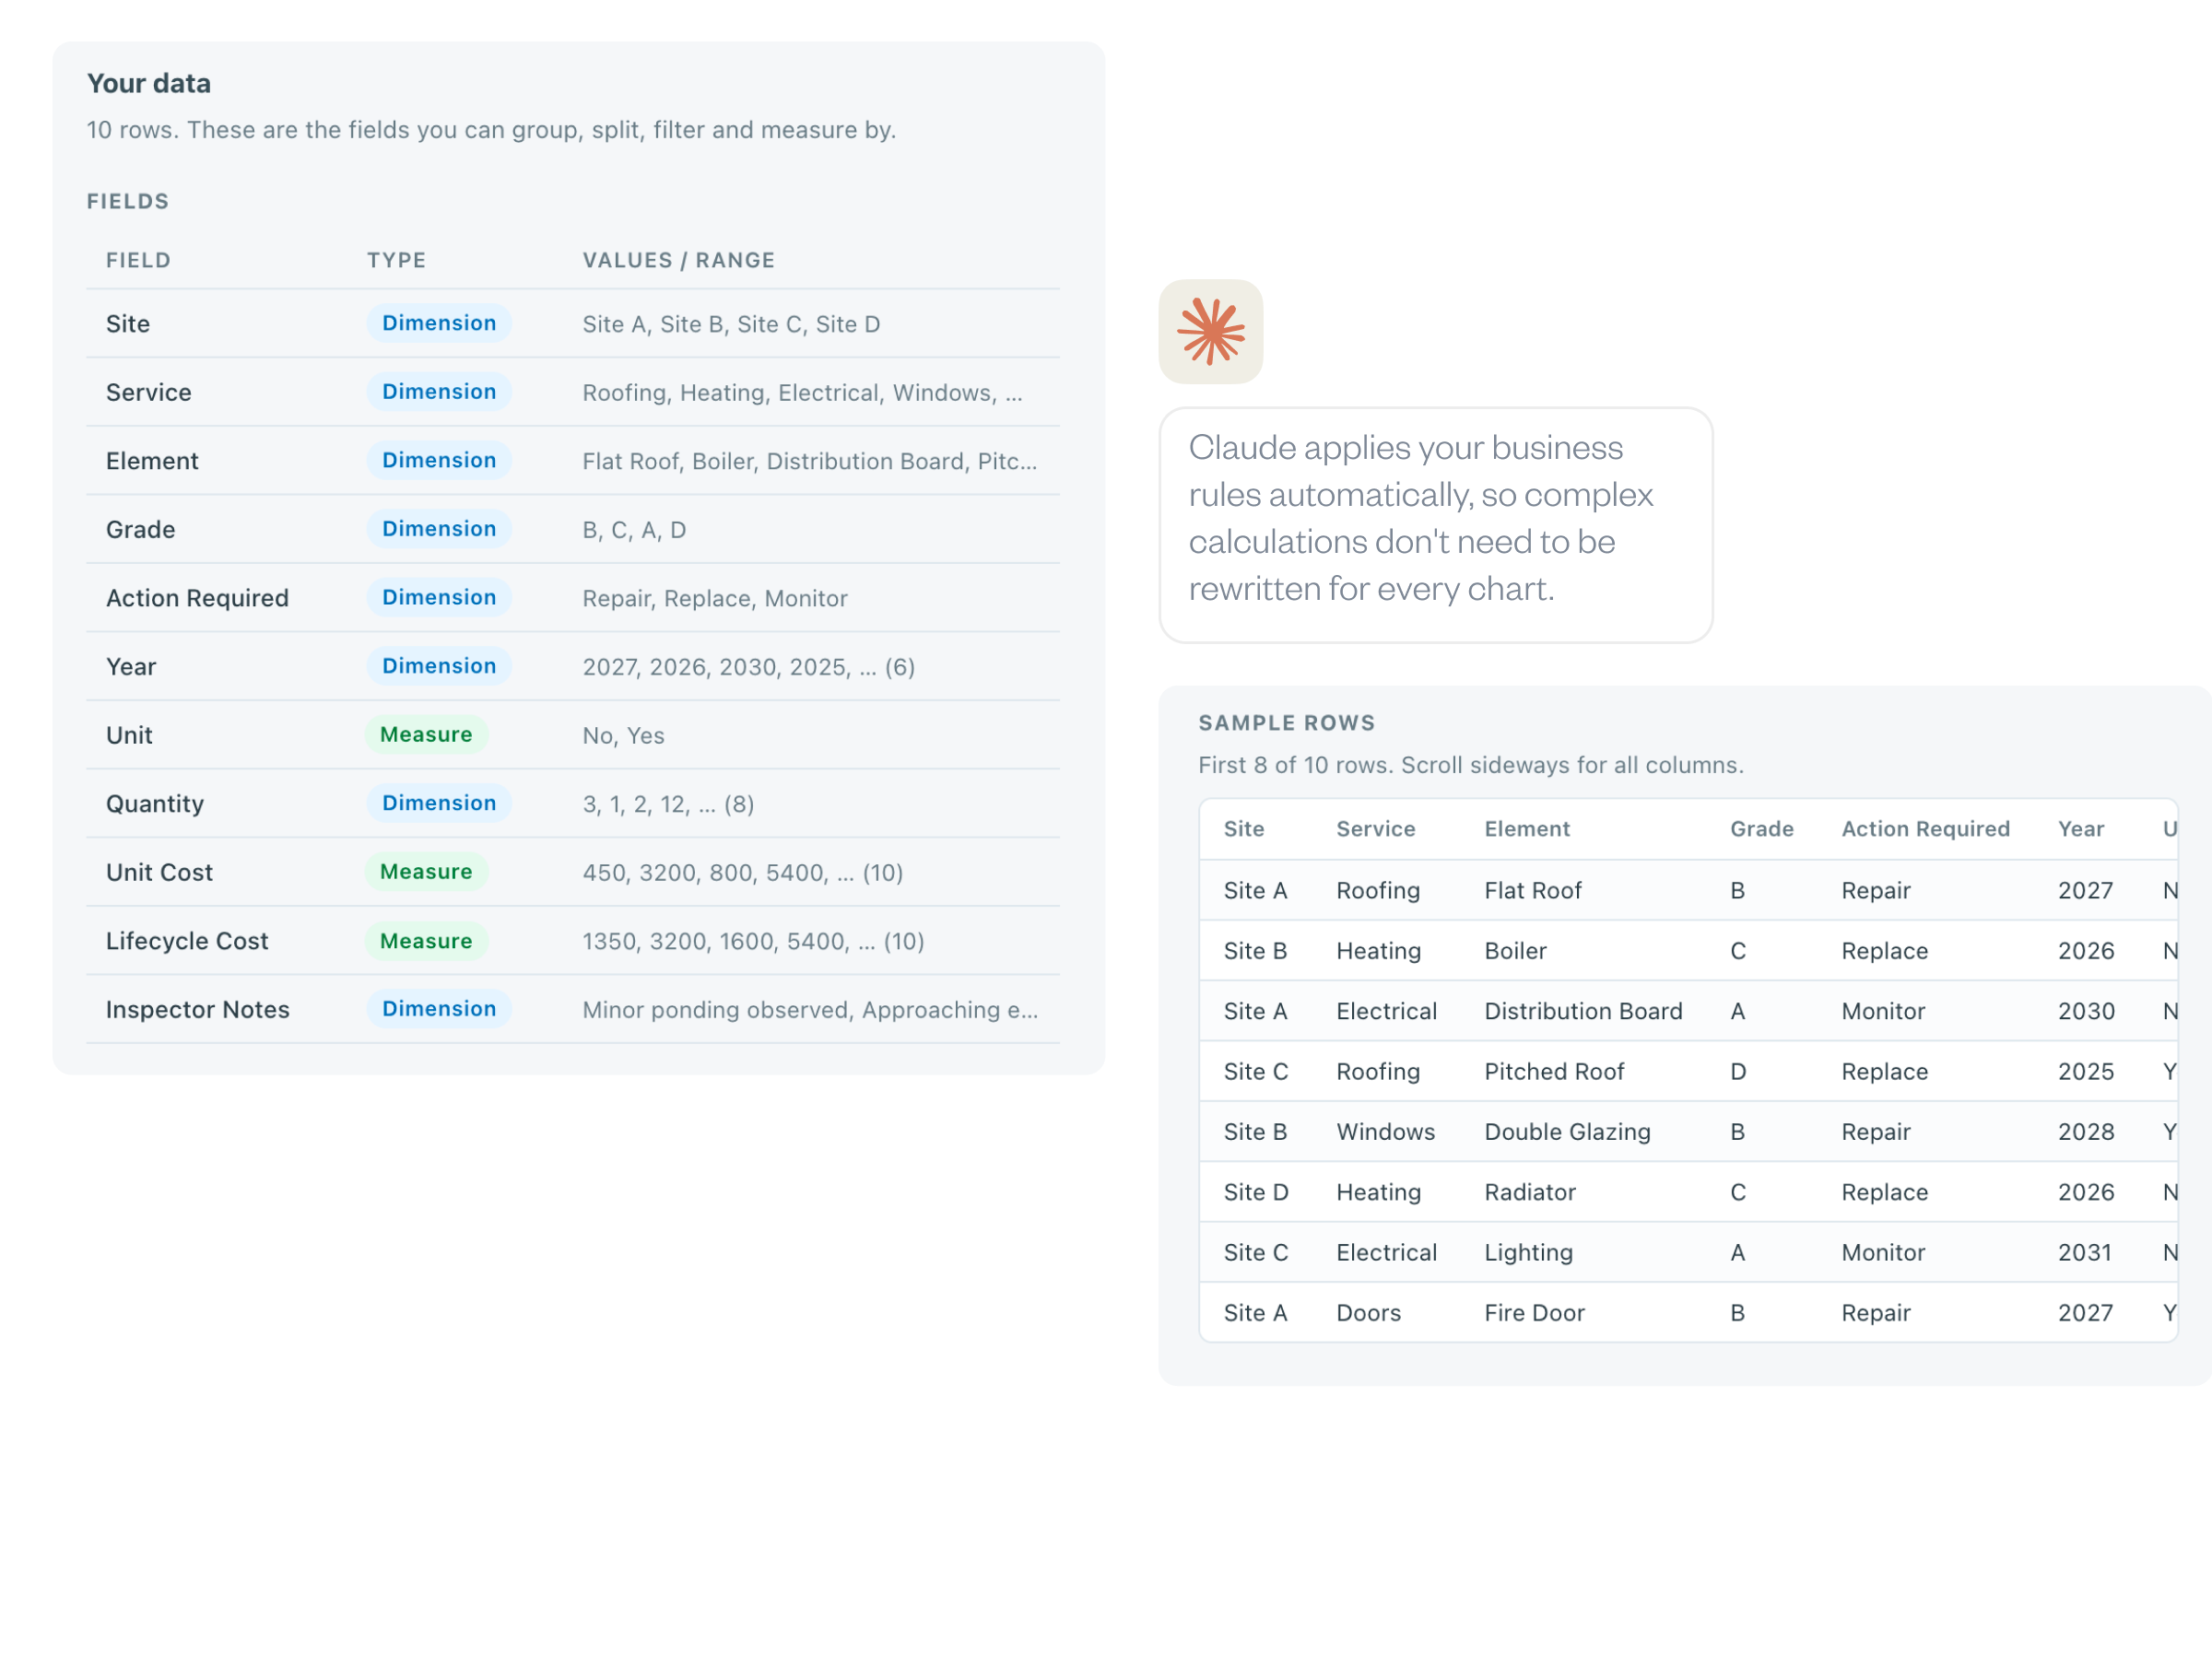
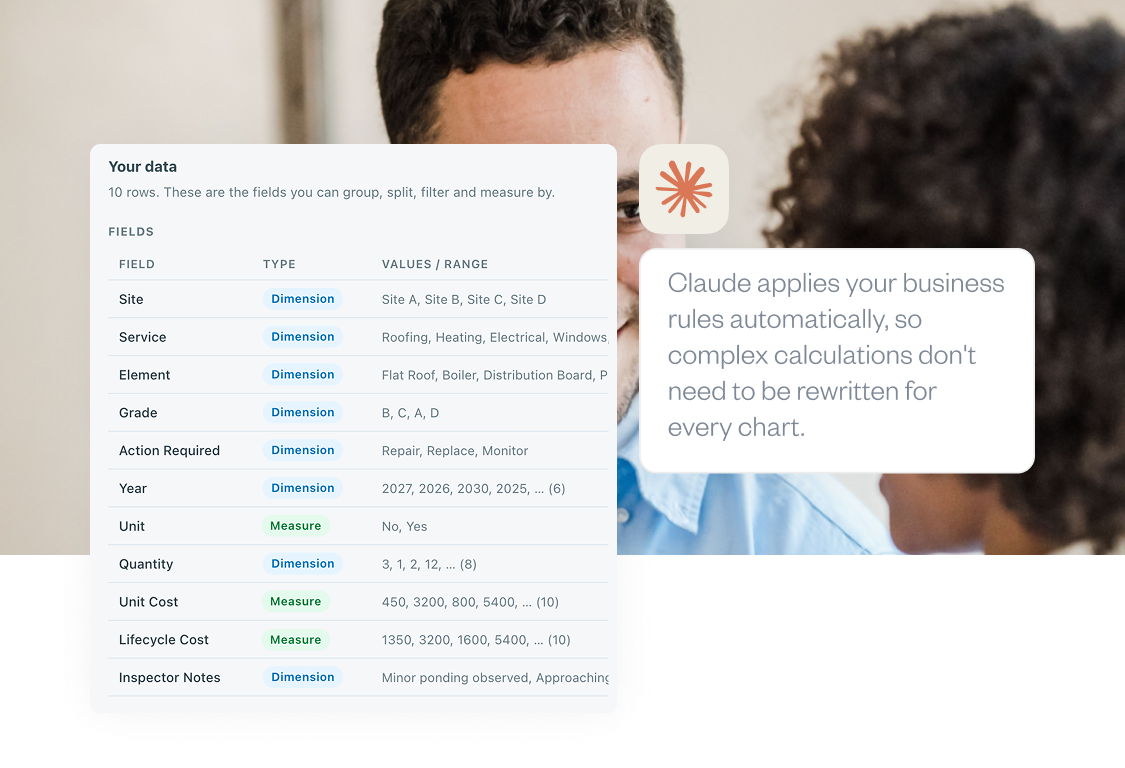
At the centre of the tool is a natural-language widget builder powered by Claude Sonnet. An ops team member uploads an exported report, describes a widget in plain English, such as “total lifecycle cost by site”, and Claude Sonnet generates the chart against the uploaded data. The data ingestion layer detects fields, dimensions and measures directly from whatever report is uploaded, rather than being hard-coded to one template, allowing the tool to work across different report types.
Some figures customers need are not columns in the underlying export - total cost as quantity multiplied by unit cost, for example - so we designed “Dashboard rules”, a free-text context box passed to Claude Sonnet alongside the detected fields every time it builds a widget. This allows calculation logic and business context to be captured once per dashboard rather than re-entered into every prompt.
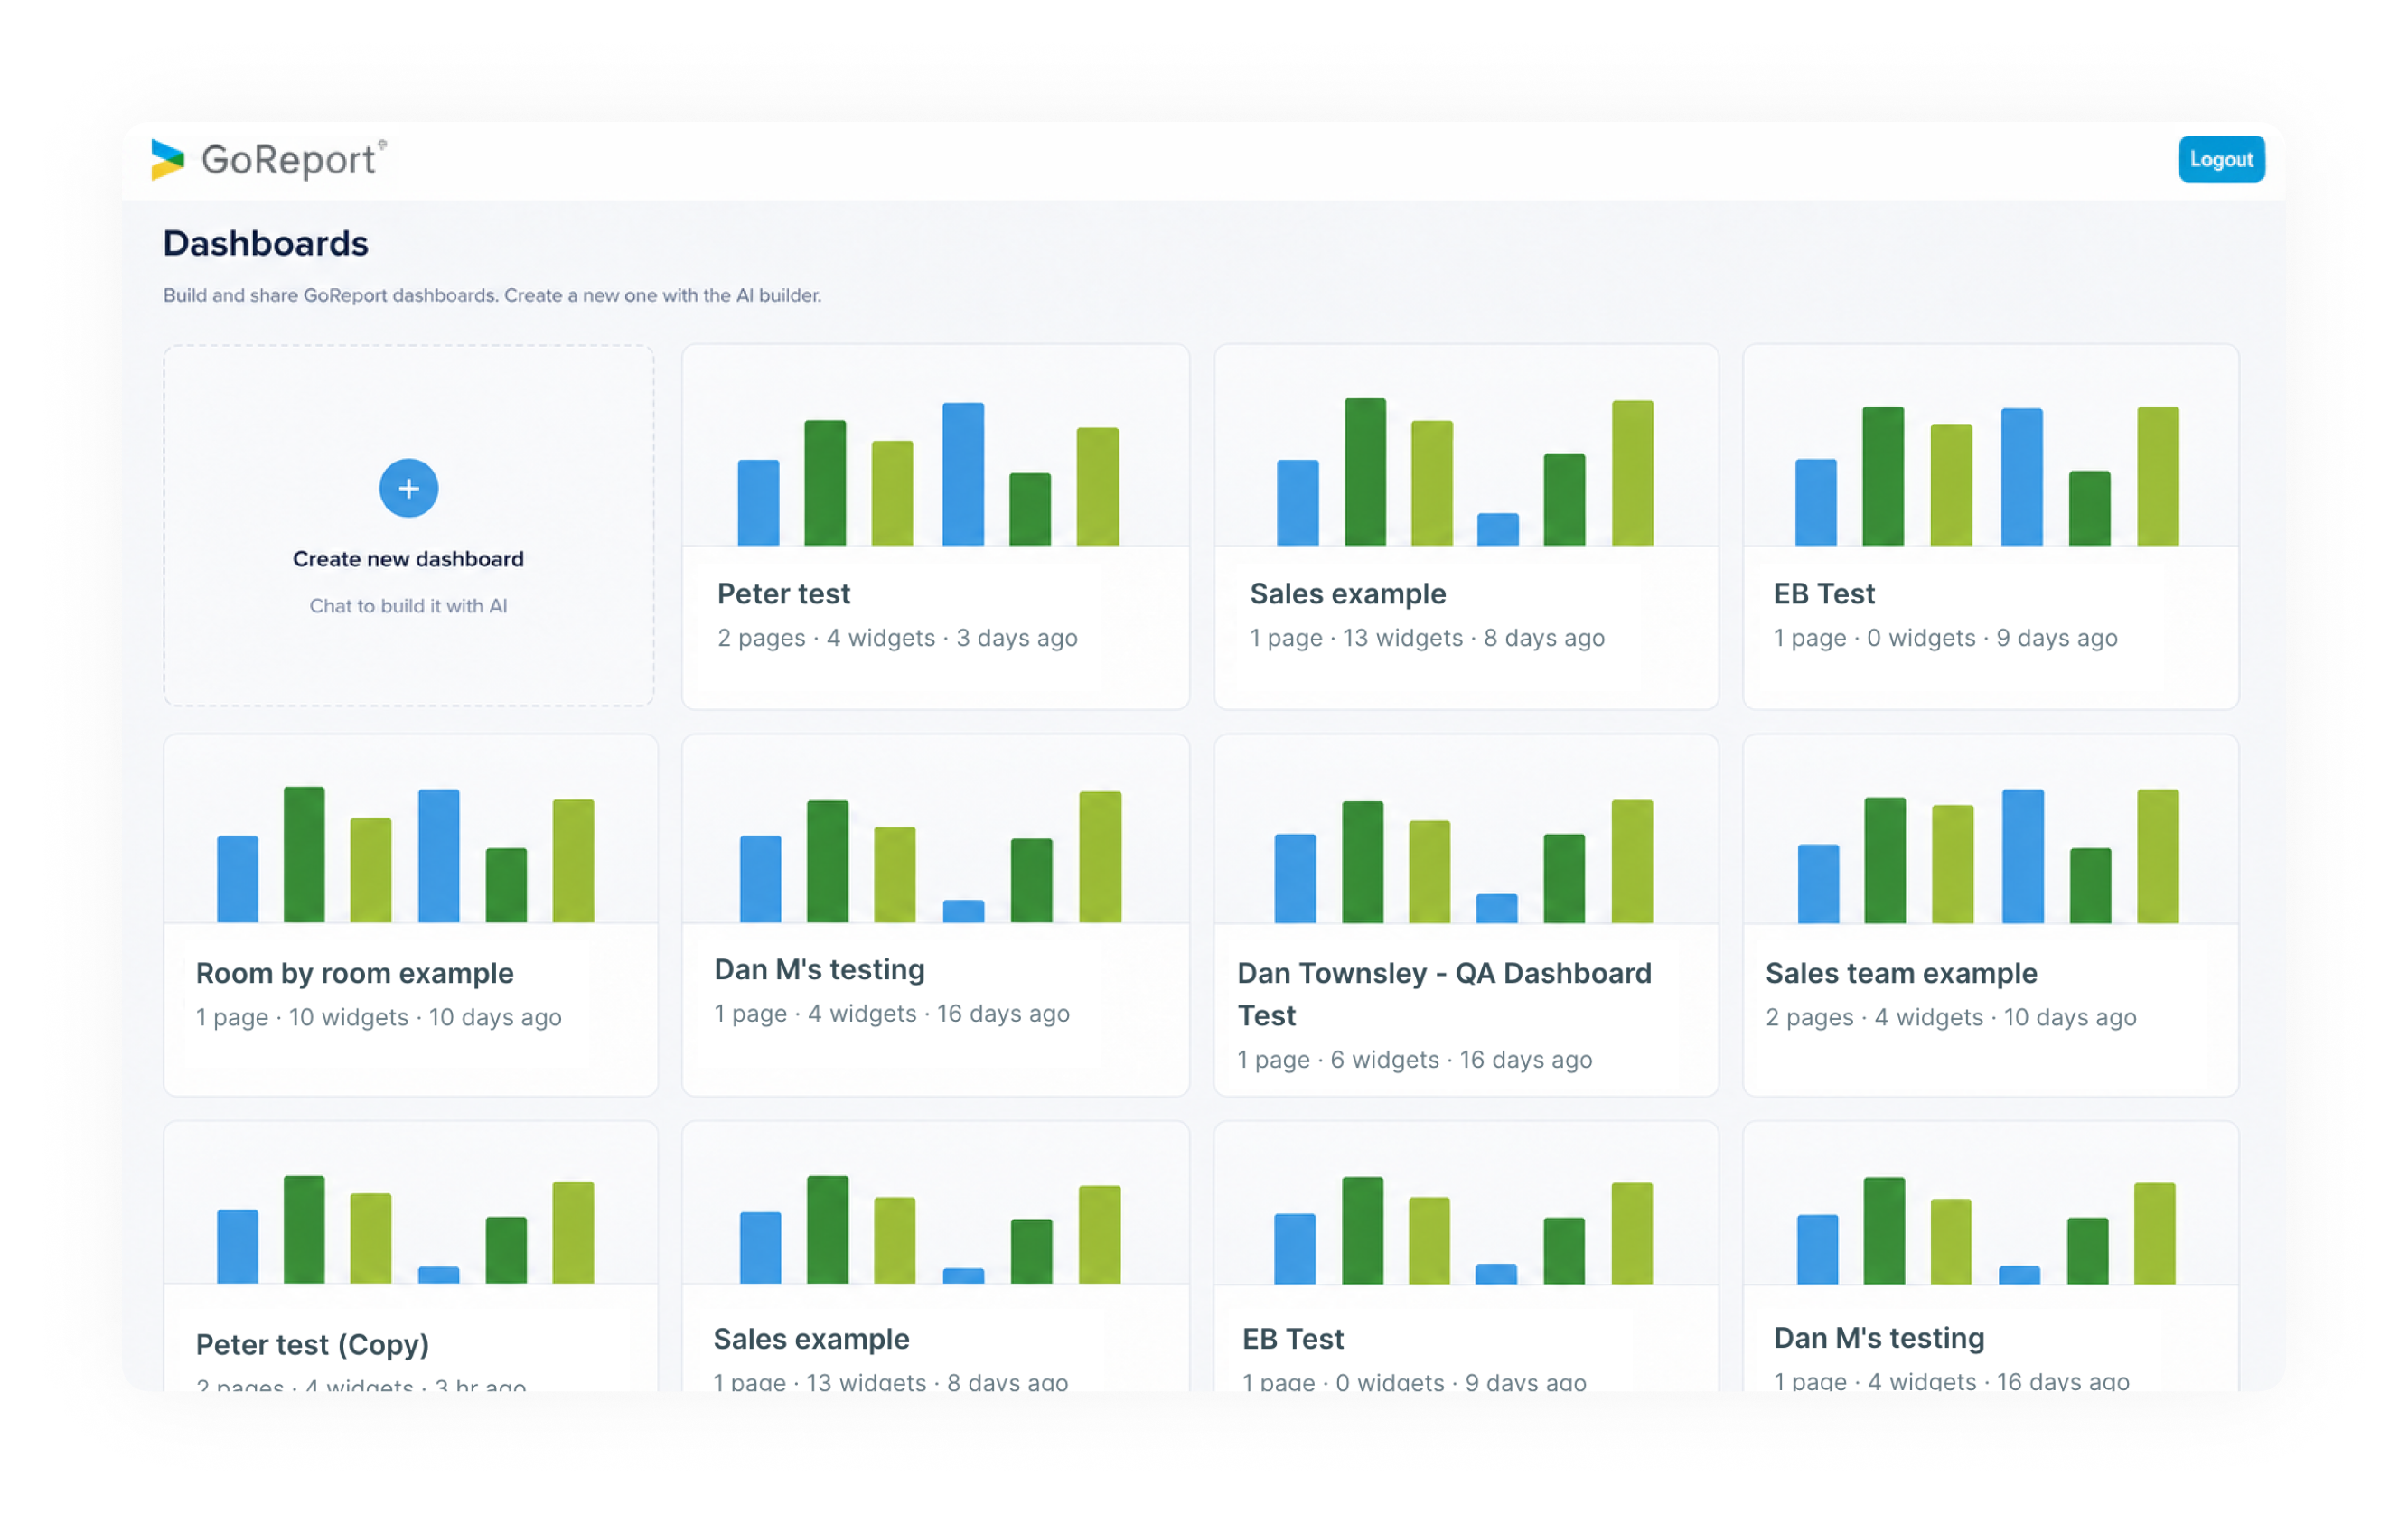
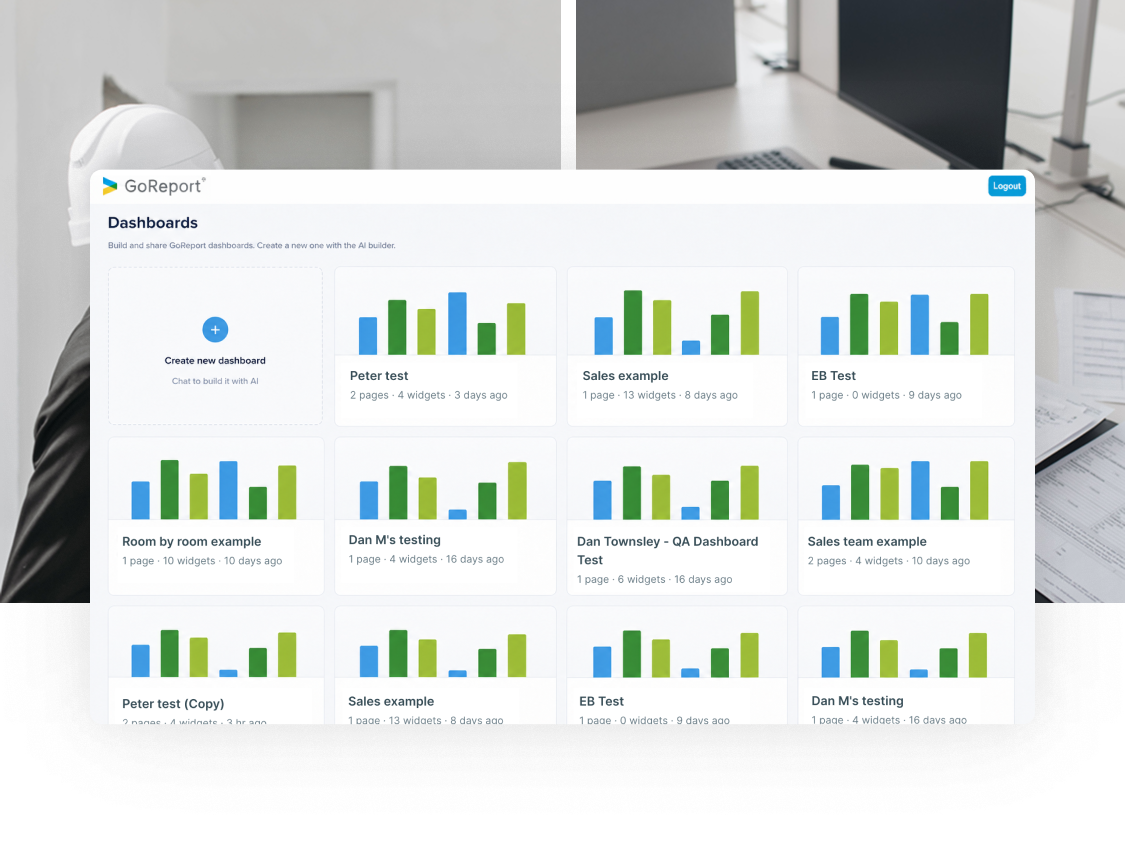
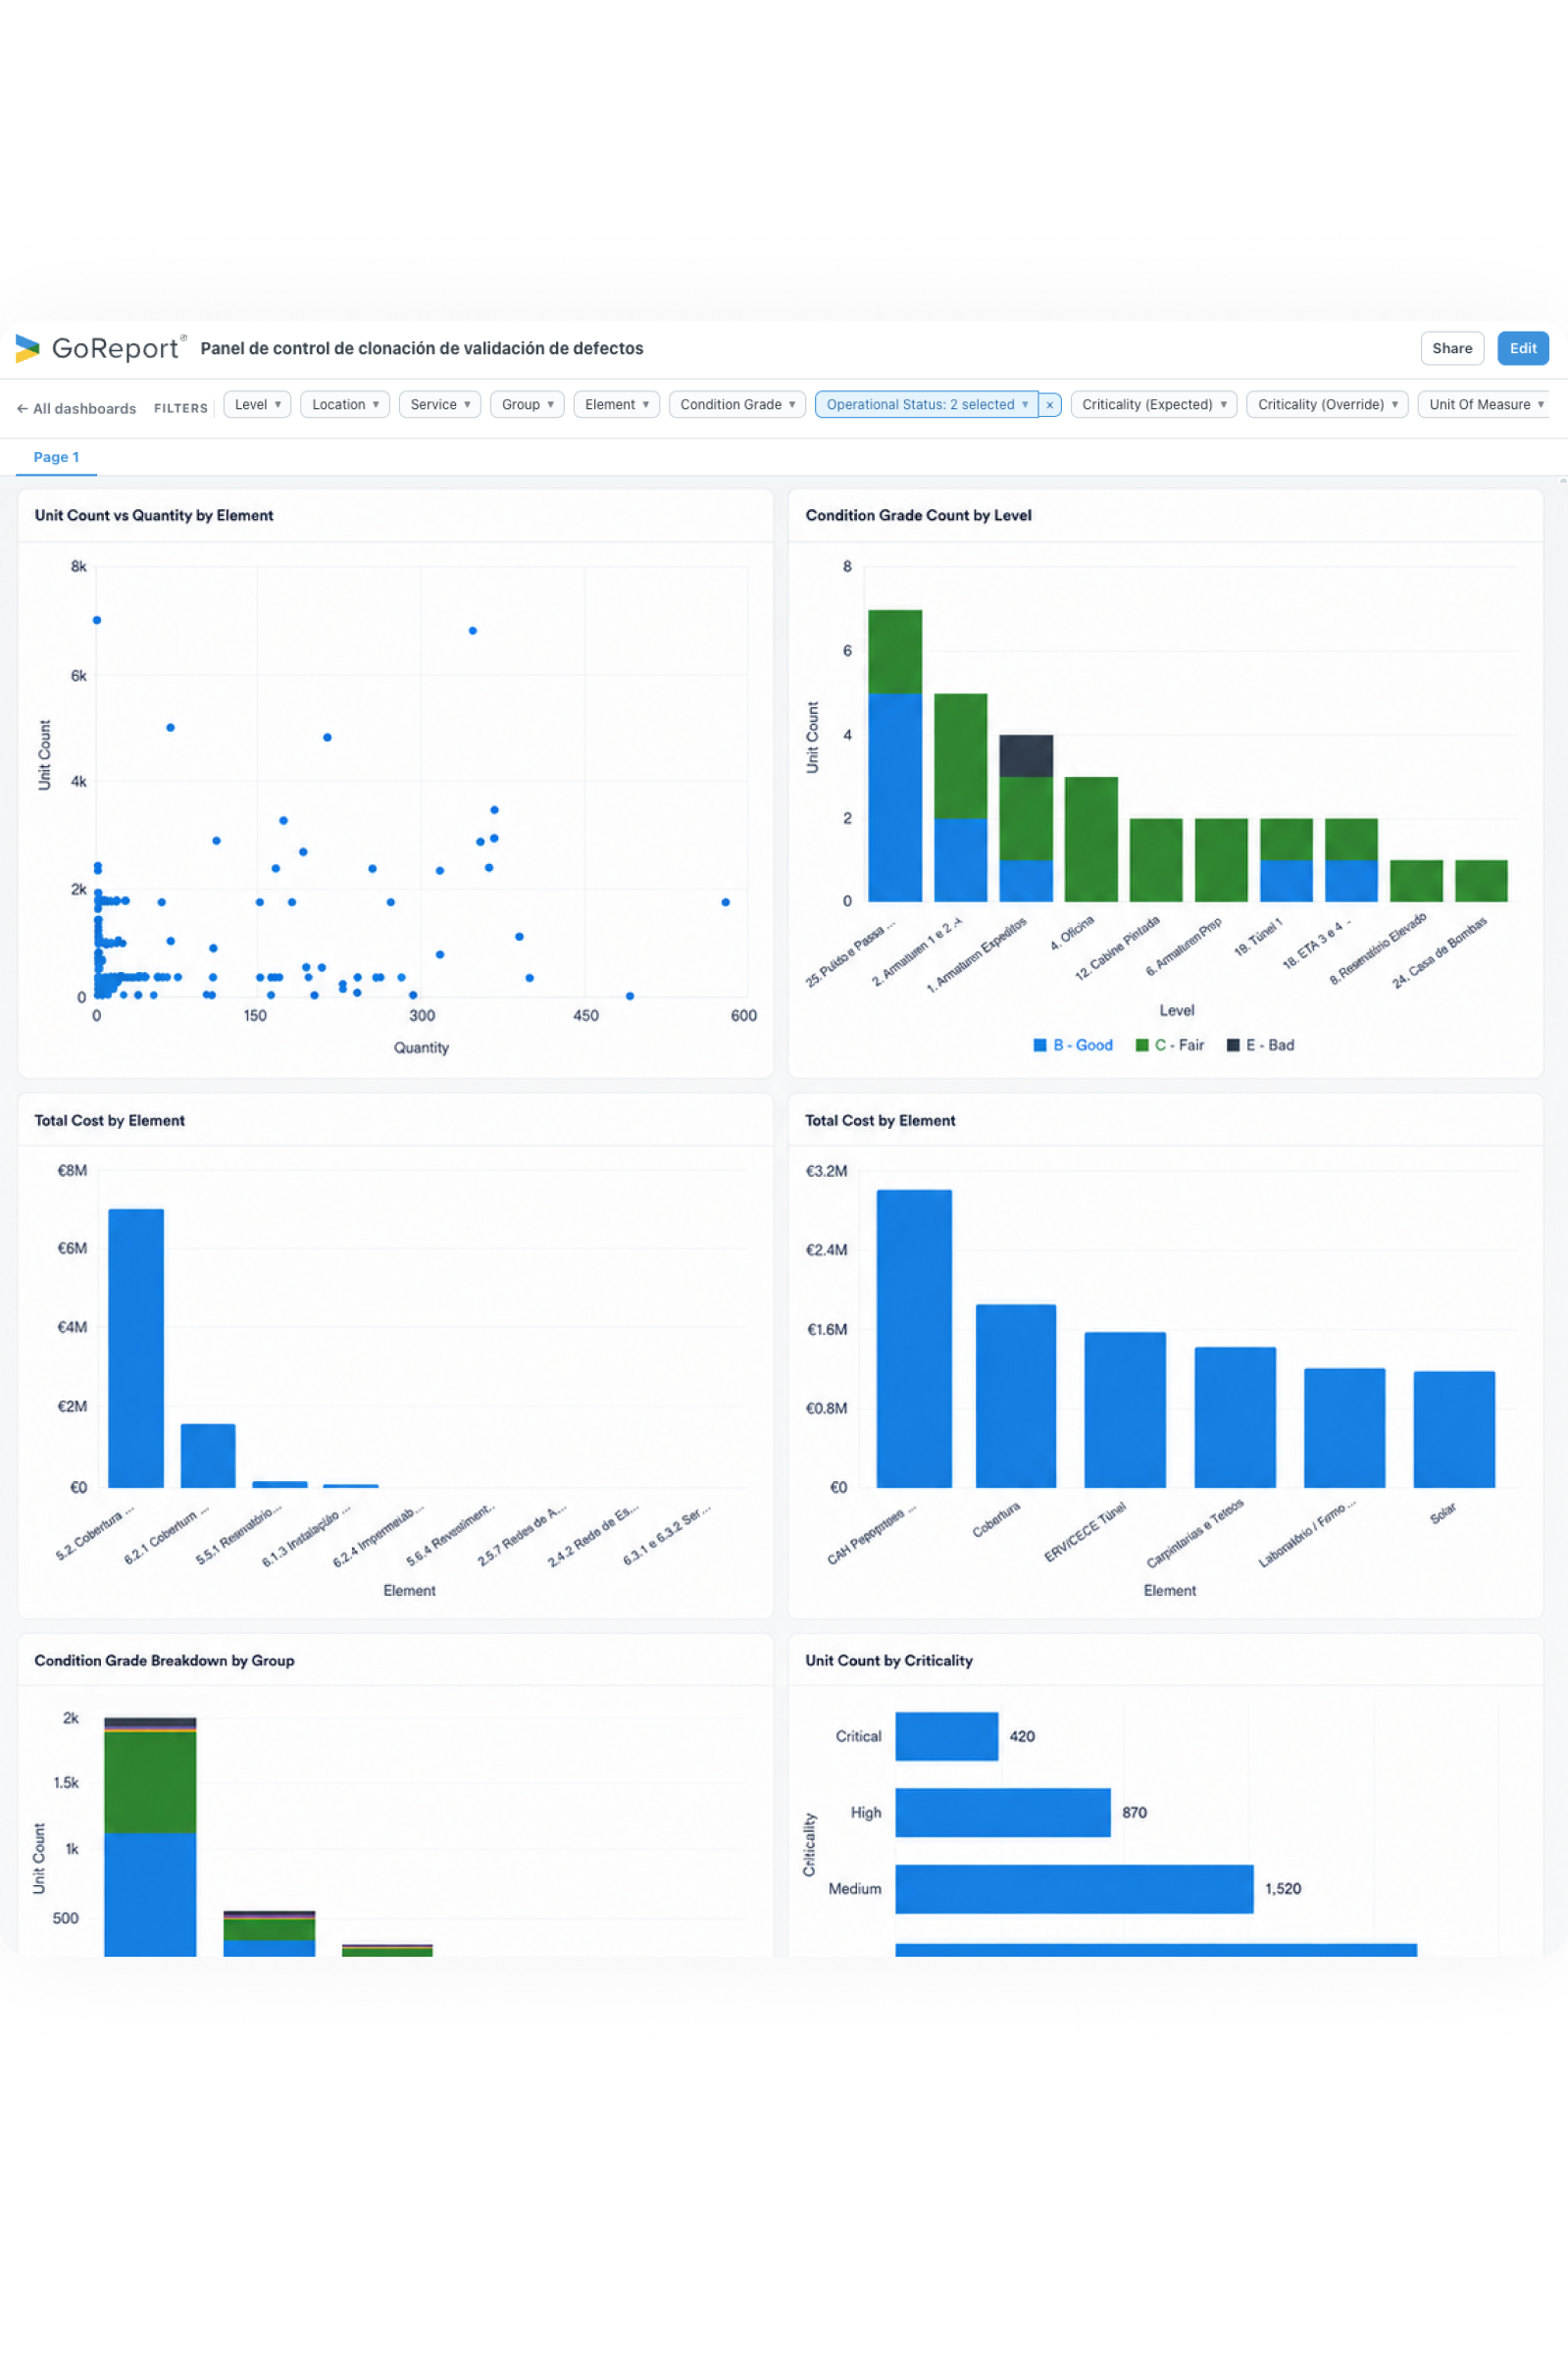
The resulting widgets can be arranged and resized across multi-page dashboards, with filters providing different ways to explore portfolio data. Dashboards are then shared externally through a three-tier, password-protected link model, giving different levels of access without requiring integration with GoReport accounts.

Results
Reduced dashboard creation time from 6–8 weeks of manual work to a few hours of self-service.
Reduced the cost of creating each dashboard from circa £100–£150 to £3–£5.
Created 10 client dashboards in production in week one, delivering estimated savings of more than £1,000.