pulse, pulse, pulse, pulse, pulse,
pulse, pulse, pulse, pulse, pulse, pulse,



Introduction
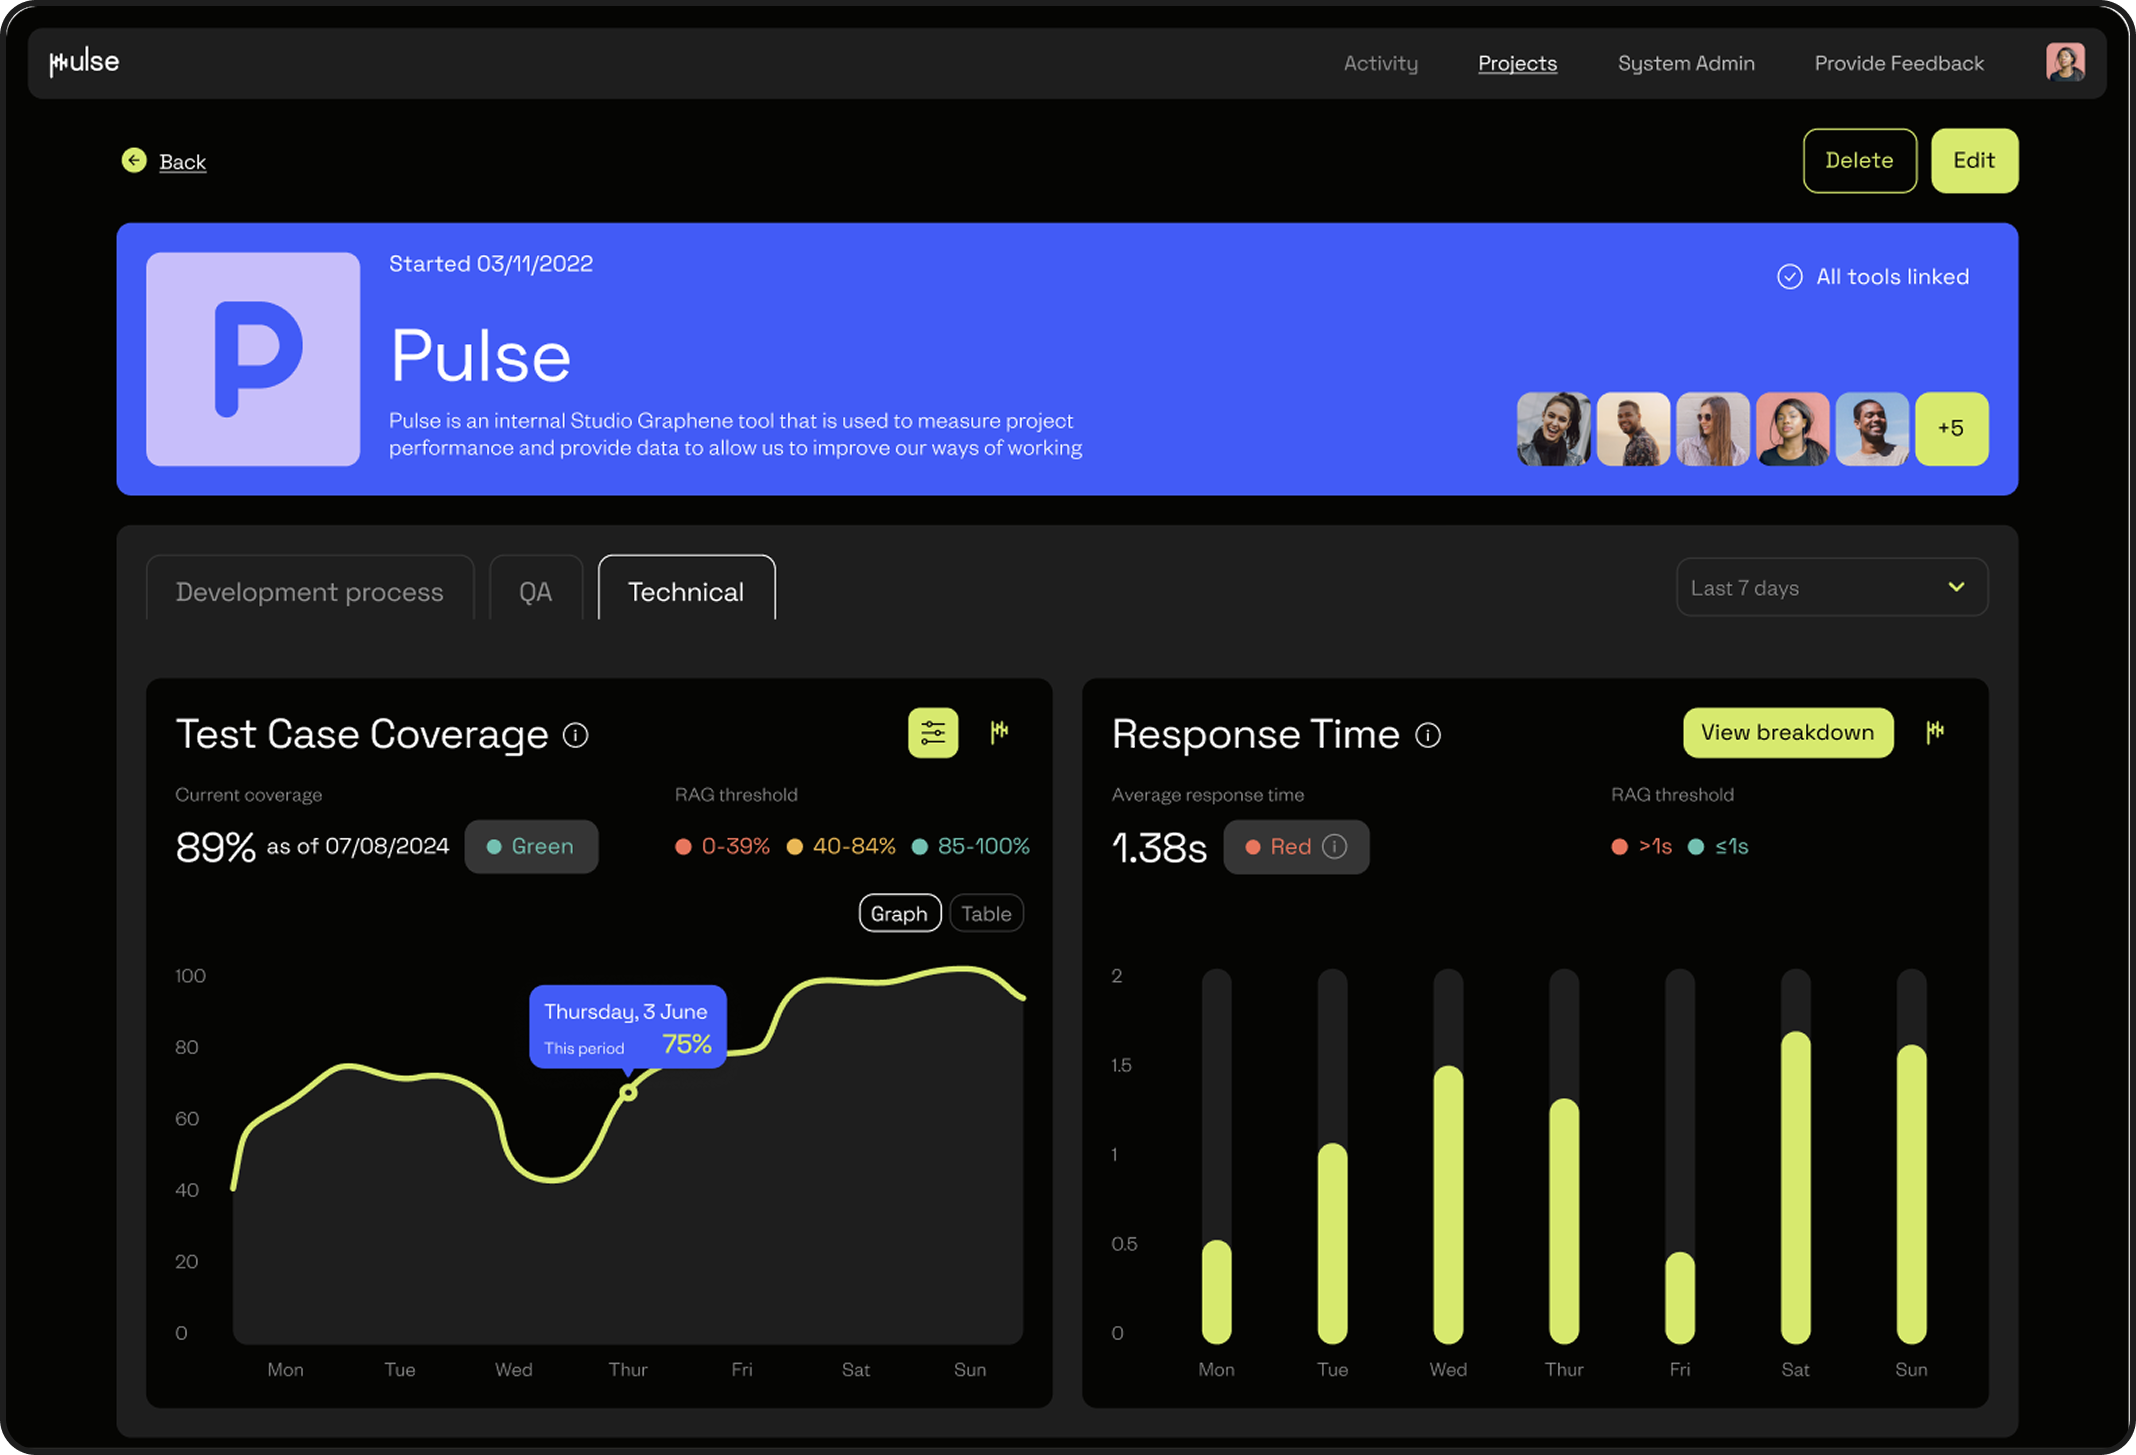
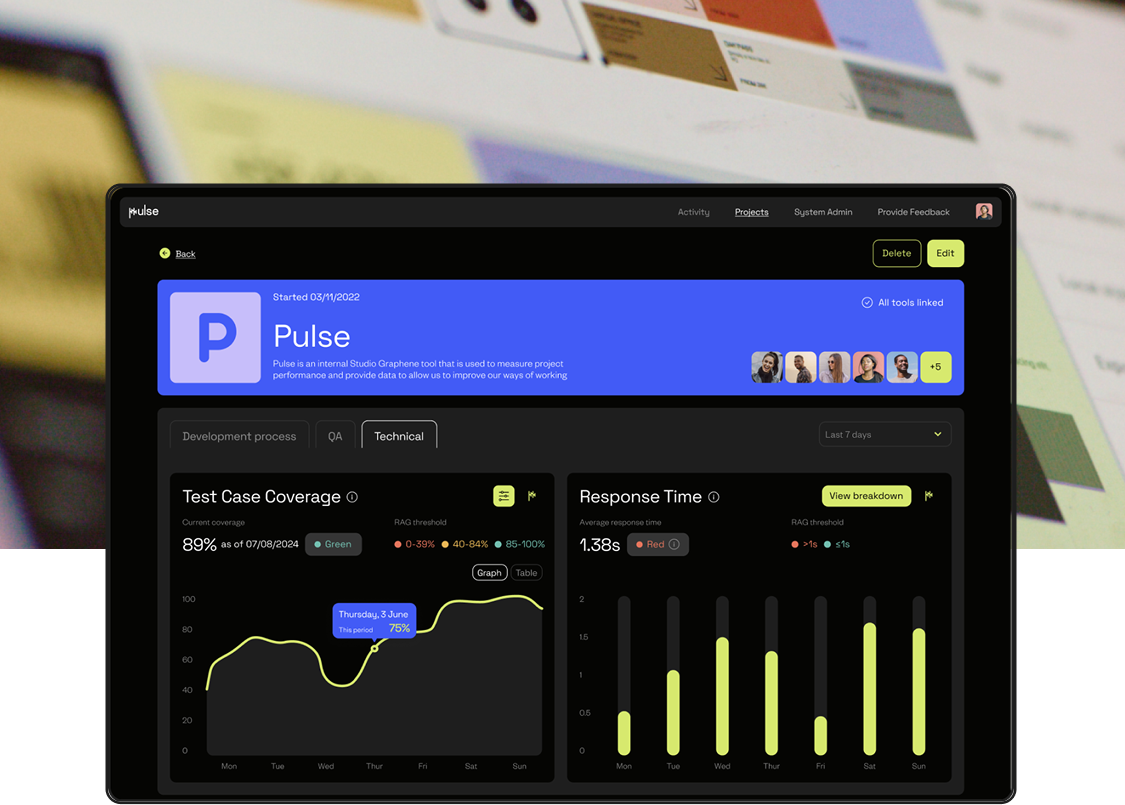
Pulse is Studio Graphene's in-house delivery intelligence platform, developed to help our teams understand how digital products are being delivered and where that delivery can improve. As our teams and client projects grew, delivery data was increasingly spread across different tools, making it difficult to build a consistent picture of quality, throughput, security and efficiency.
Existing platforms tended to focus on individual engineering metrics or single product teams, rather than the multiple concurrent projects of a digital product studio. We decided to build our own, creating a platform that could bring delivery data together, turn it into useful insight and help us continuously improve how we deliver for clients.

Interviews and workshops with product managers, engineers and QA analysts helped us understand what teams needed from the platform and prioritise the metrics that could have the greatest impact.
Solution
We began by analysing data from previous projects to understand which measures provided the clearest signals of delivery performance, from defect reopen rates and peer-review wait times to code quality.
Interviews and workshops with product managers, engineers and QA analysts helped us understand what teams needed from the platform and prioritise the metrics that could have the greatest impact.
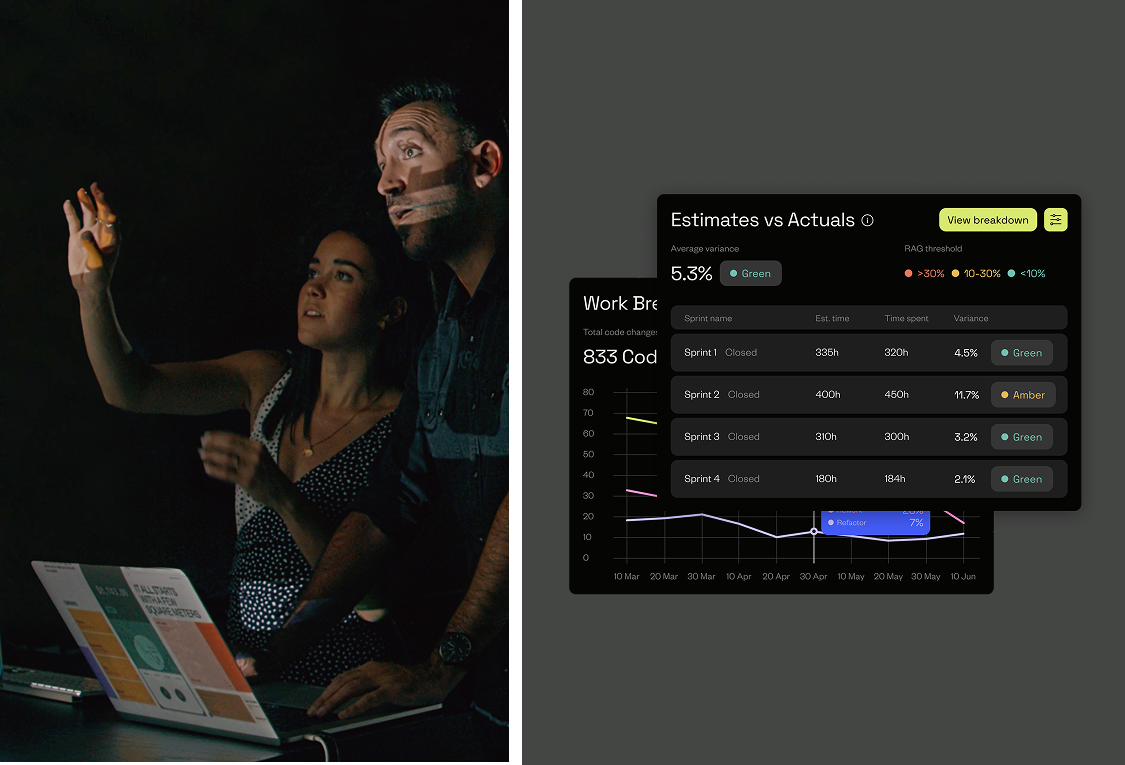
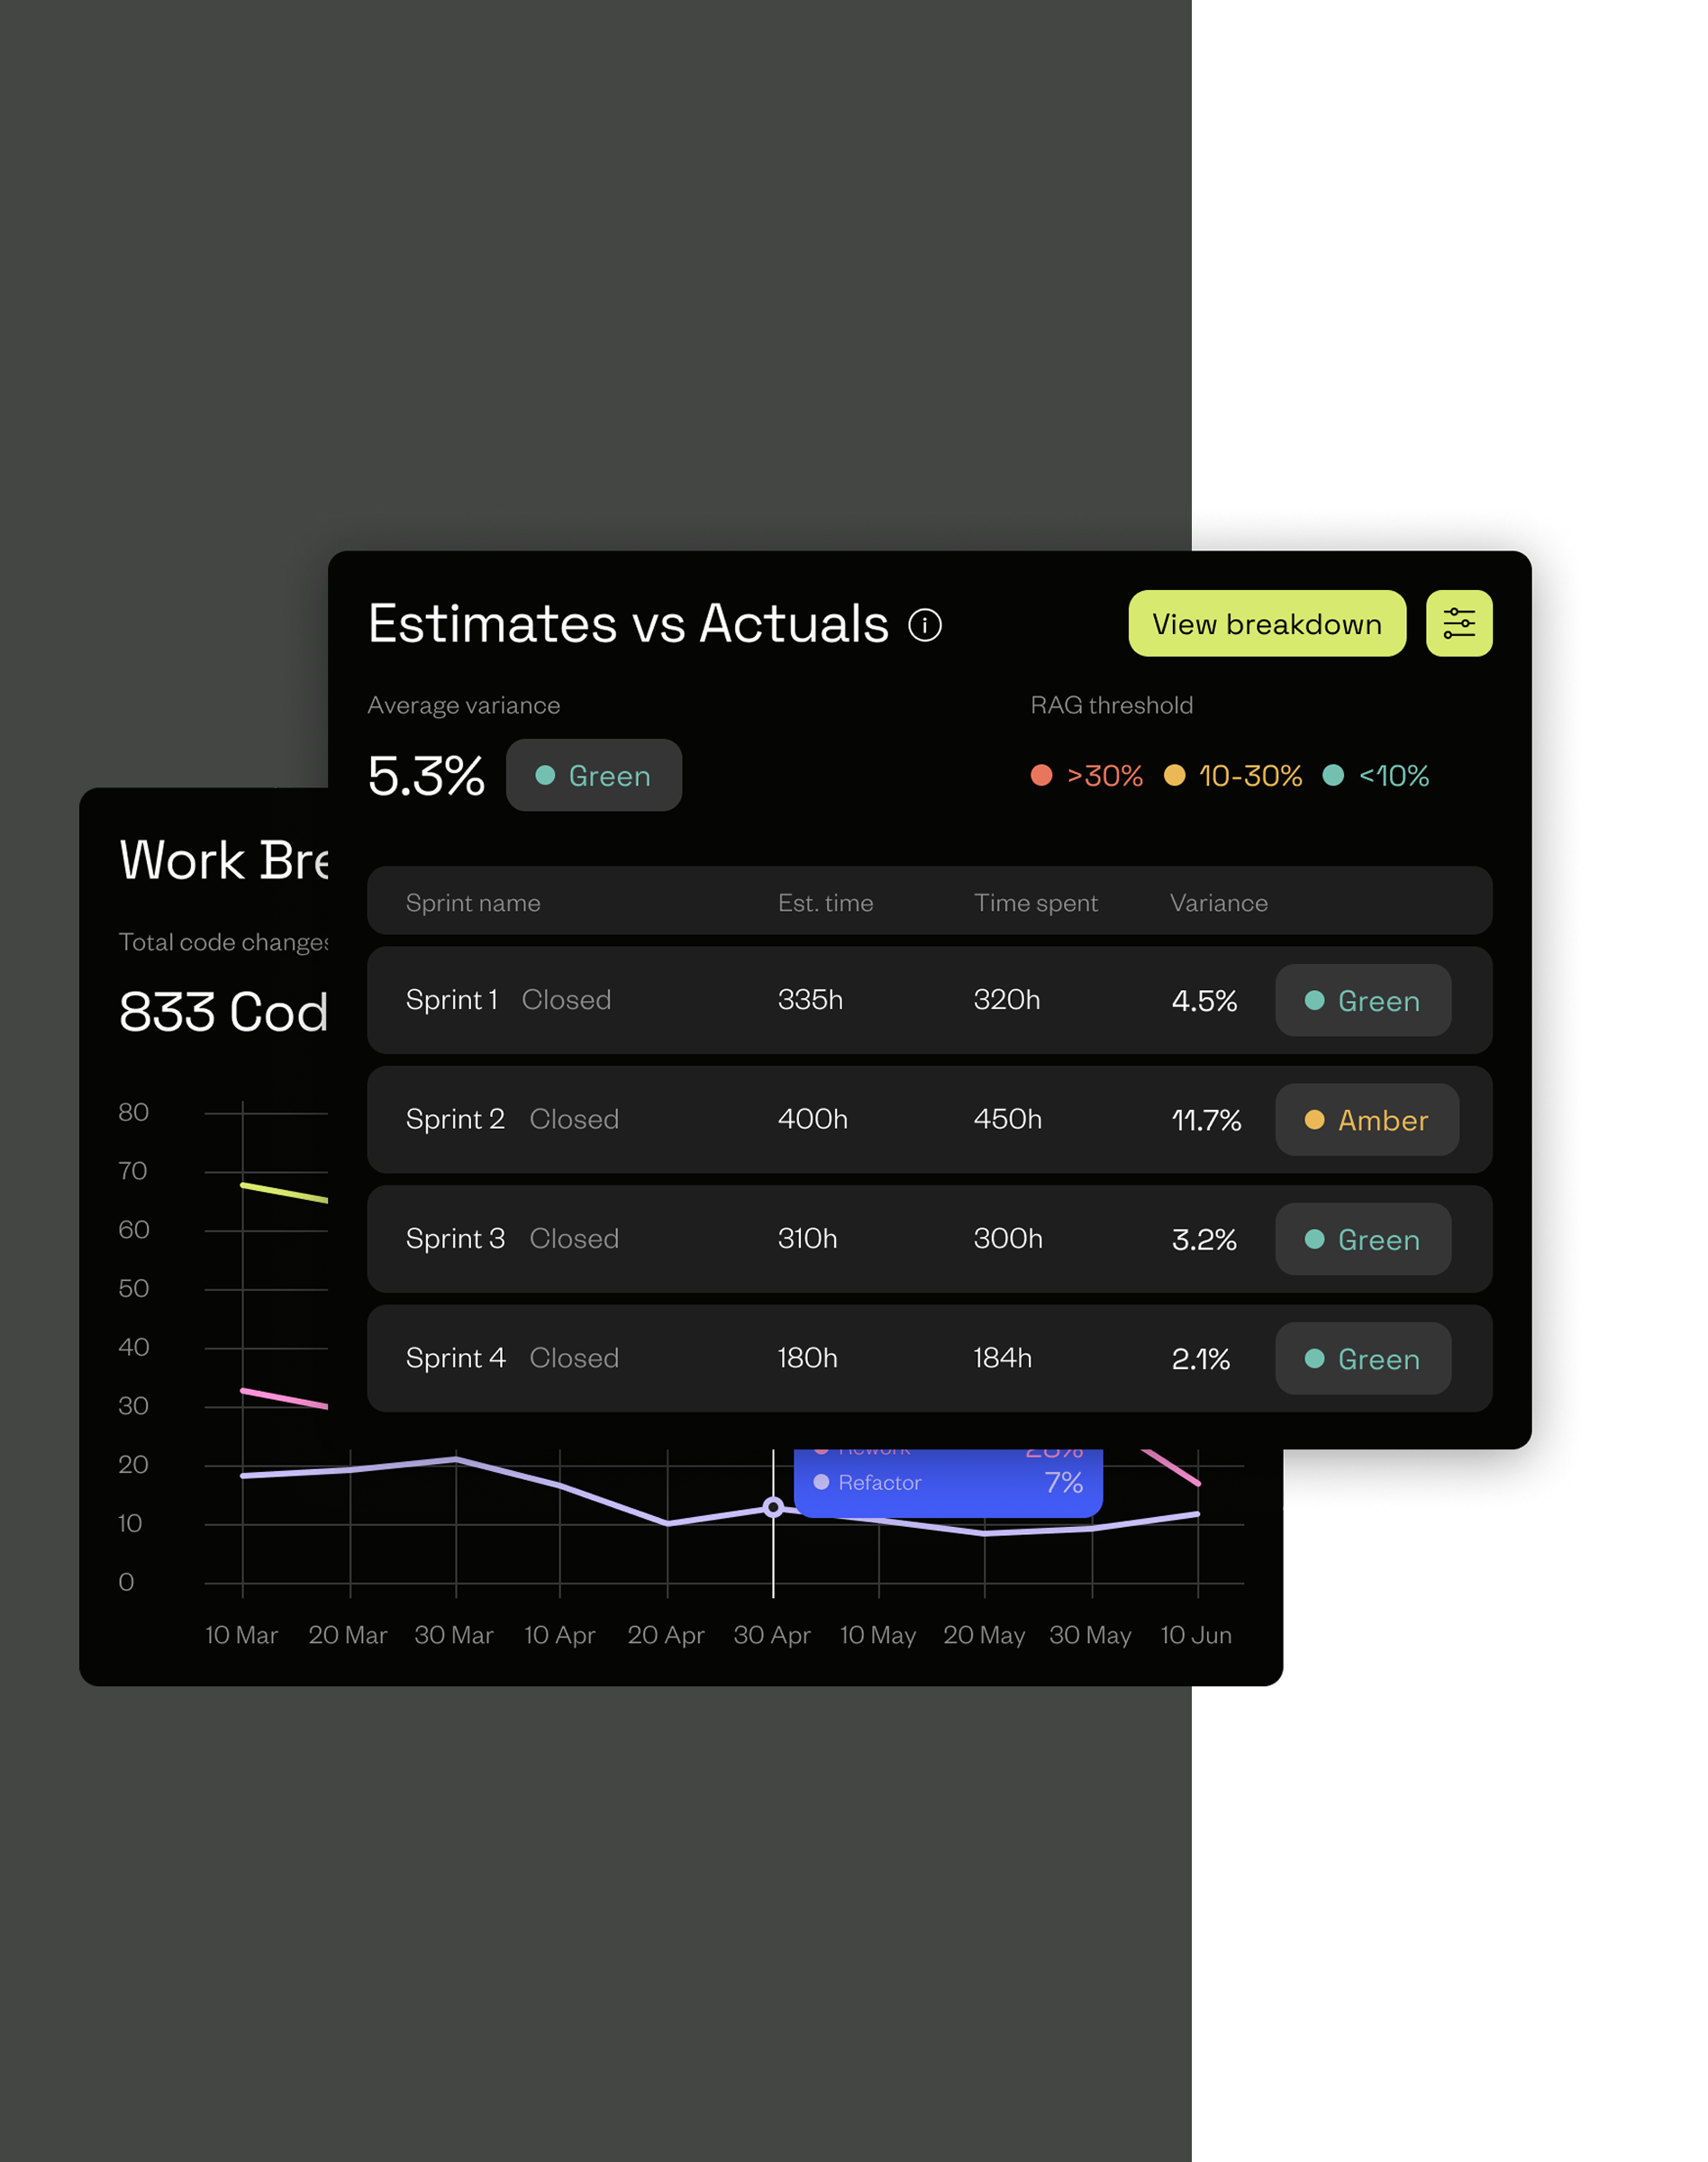
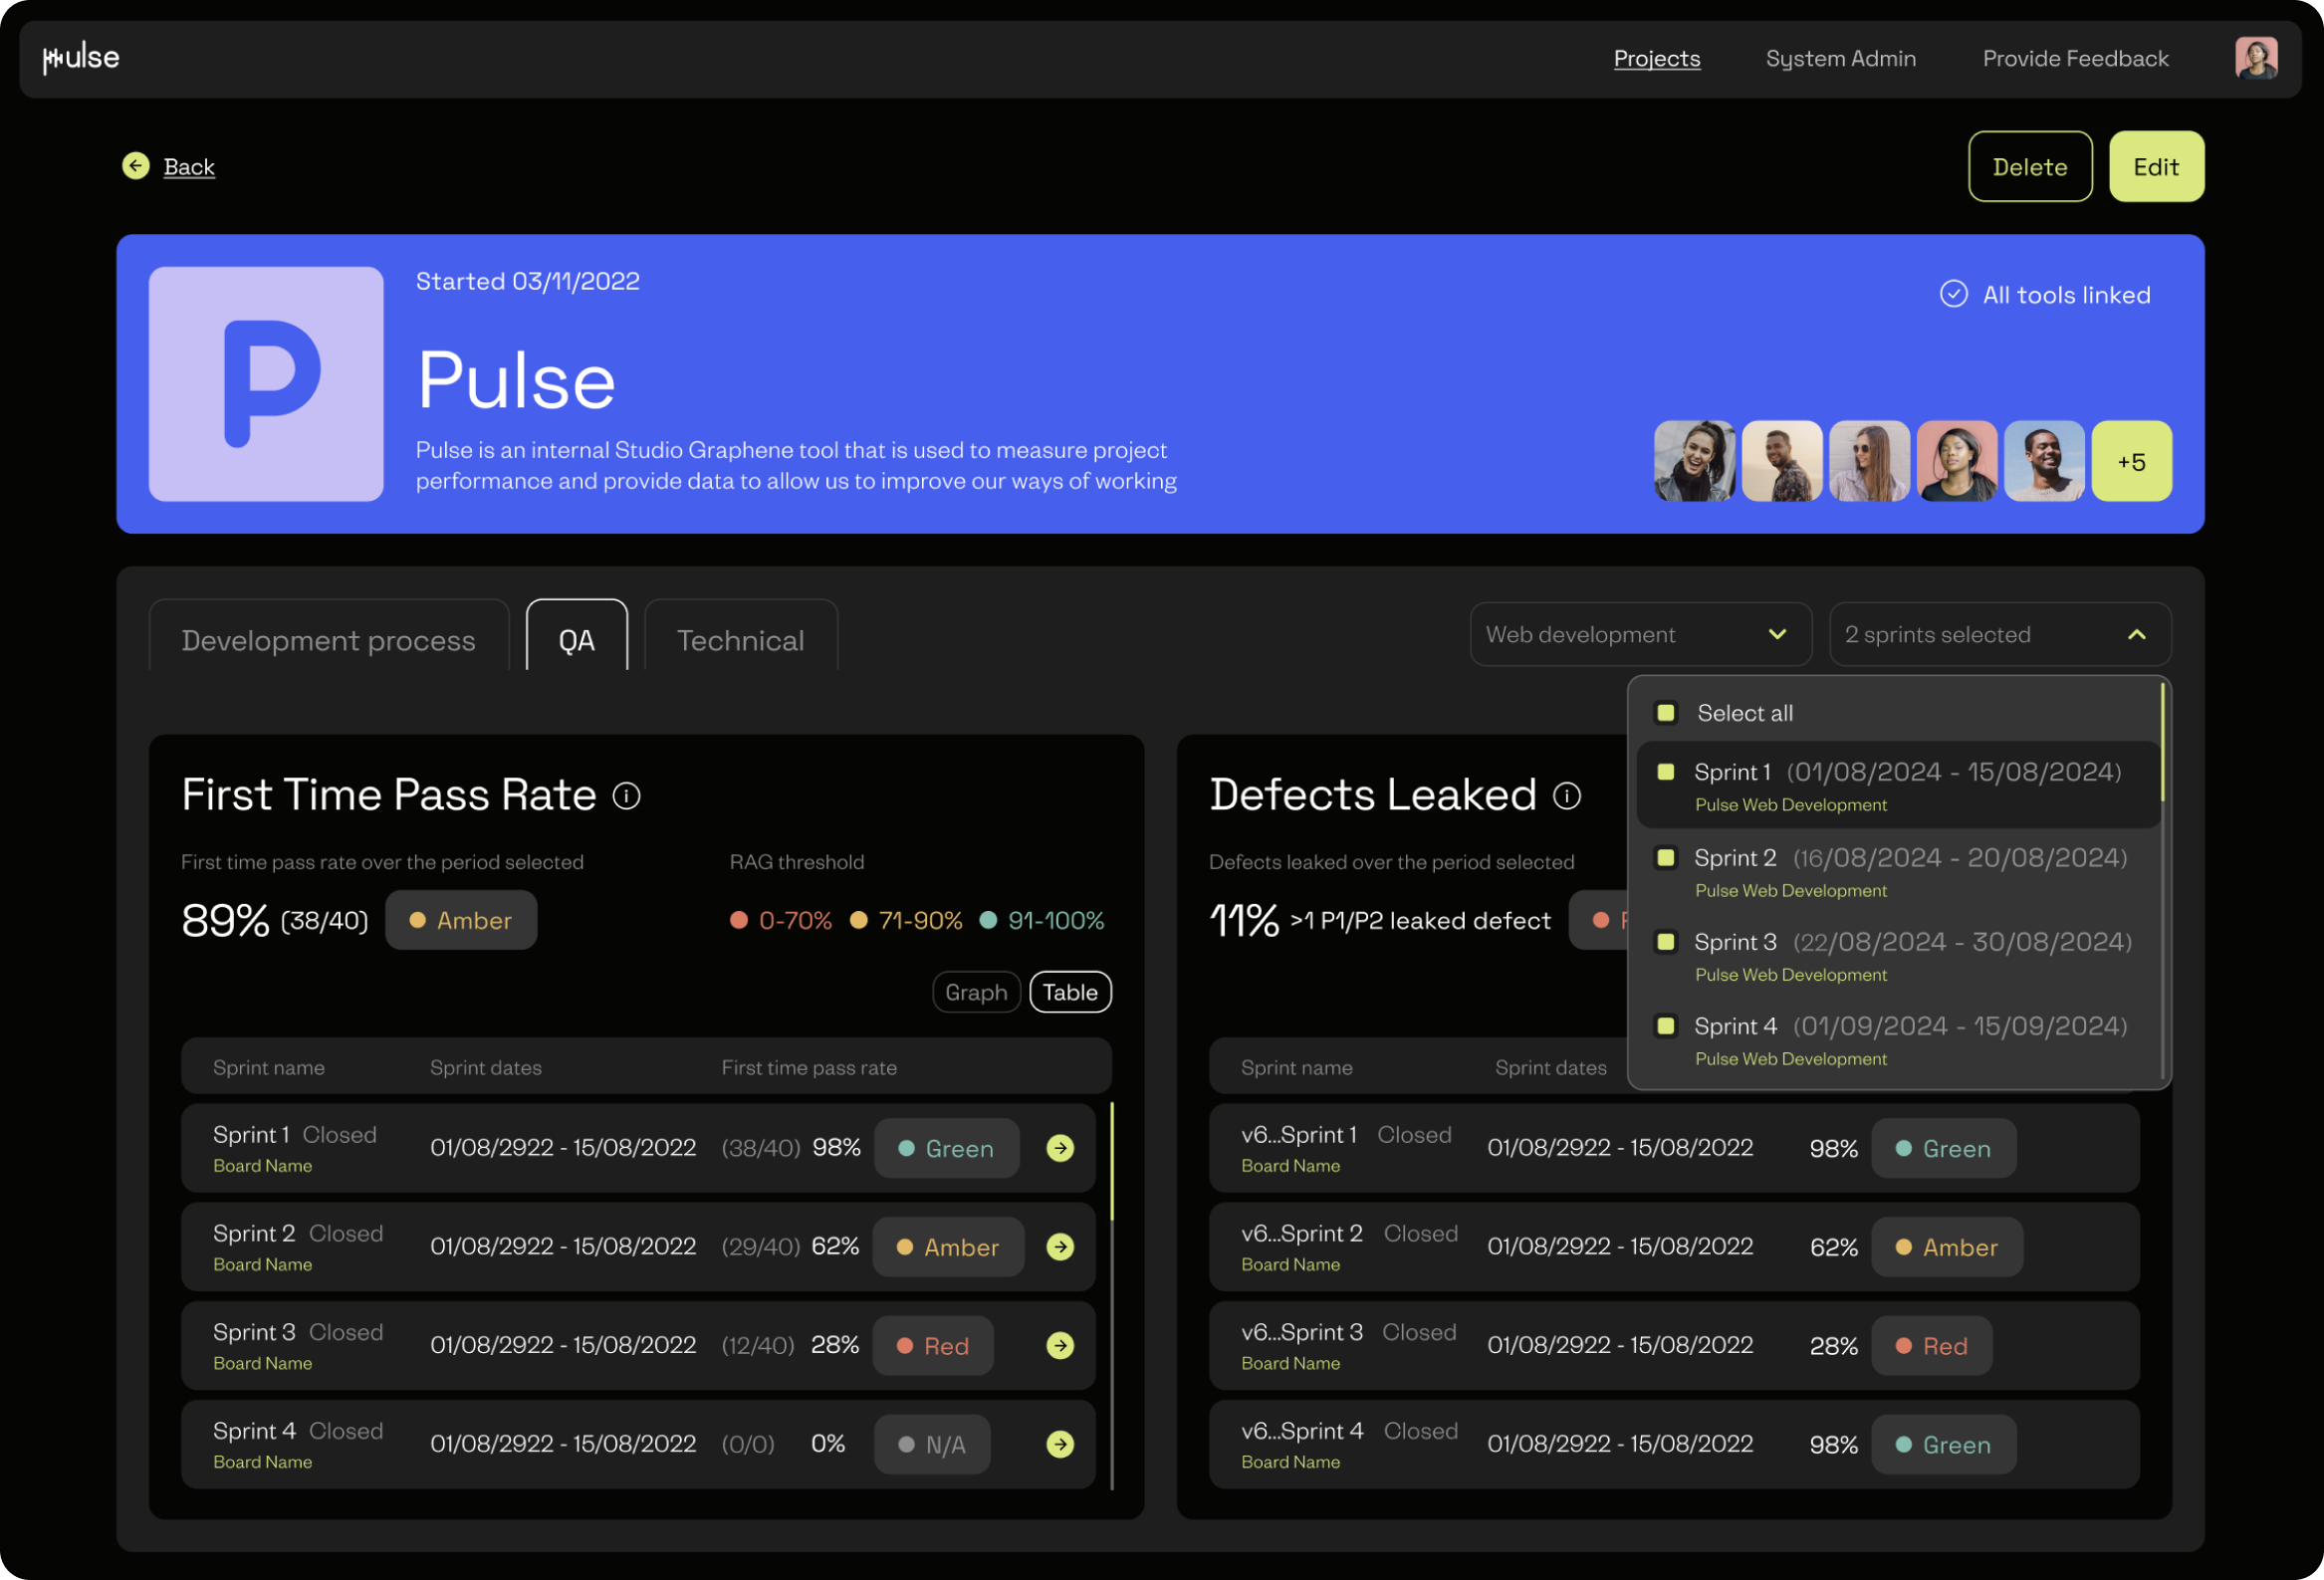
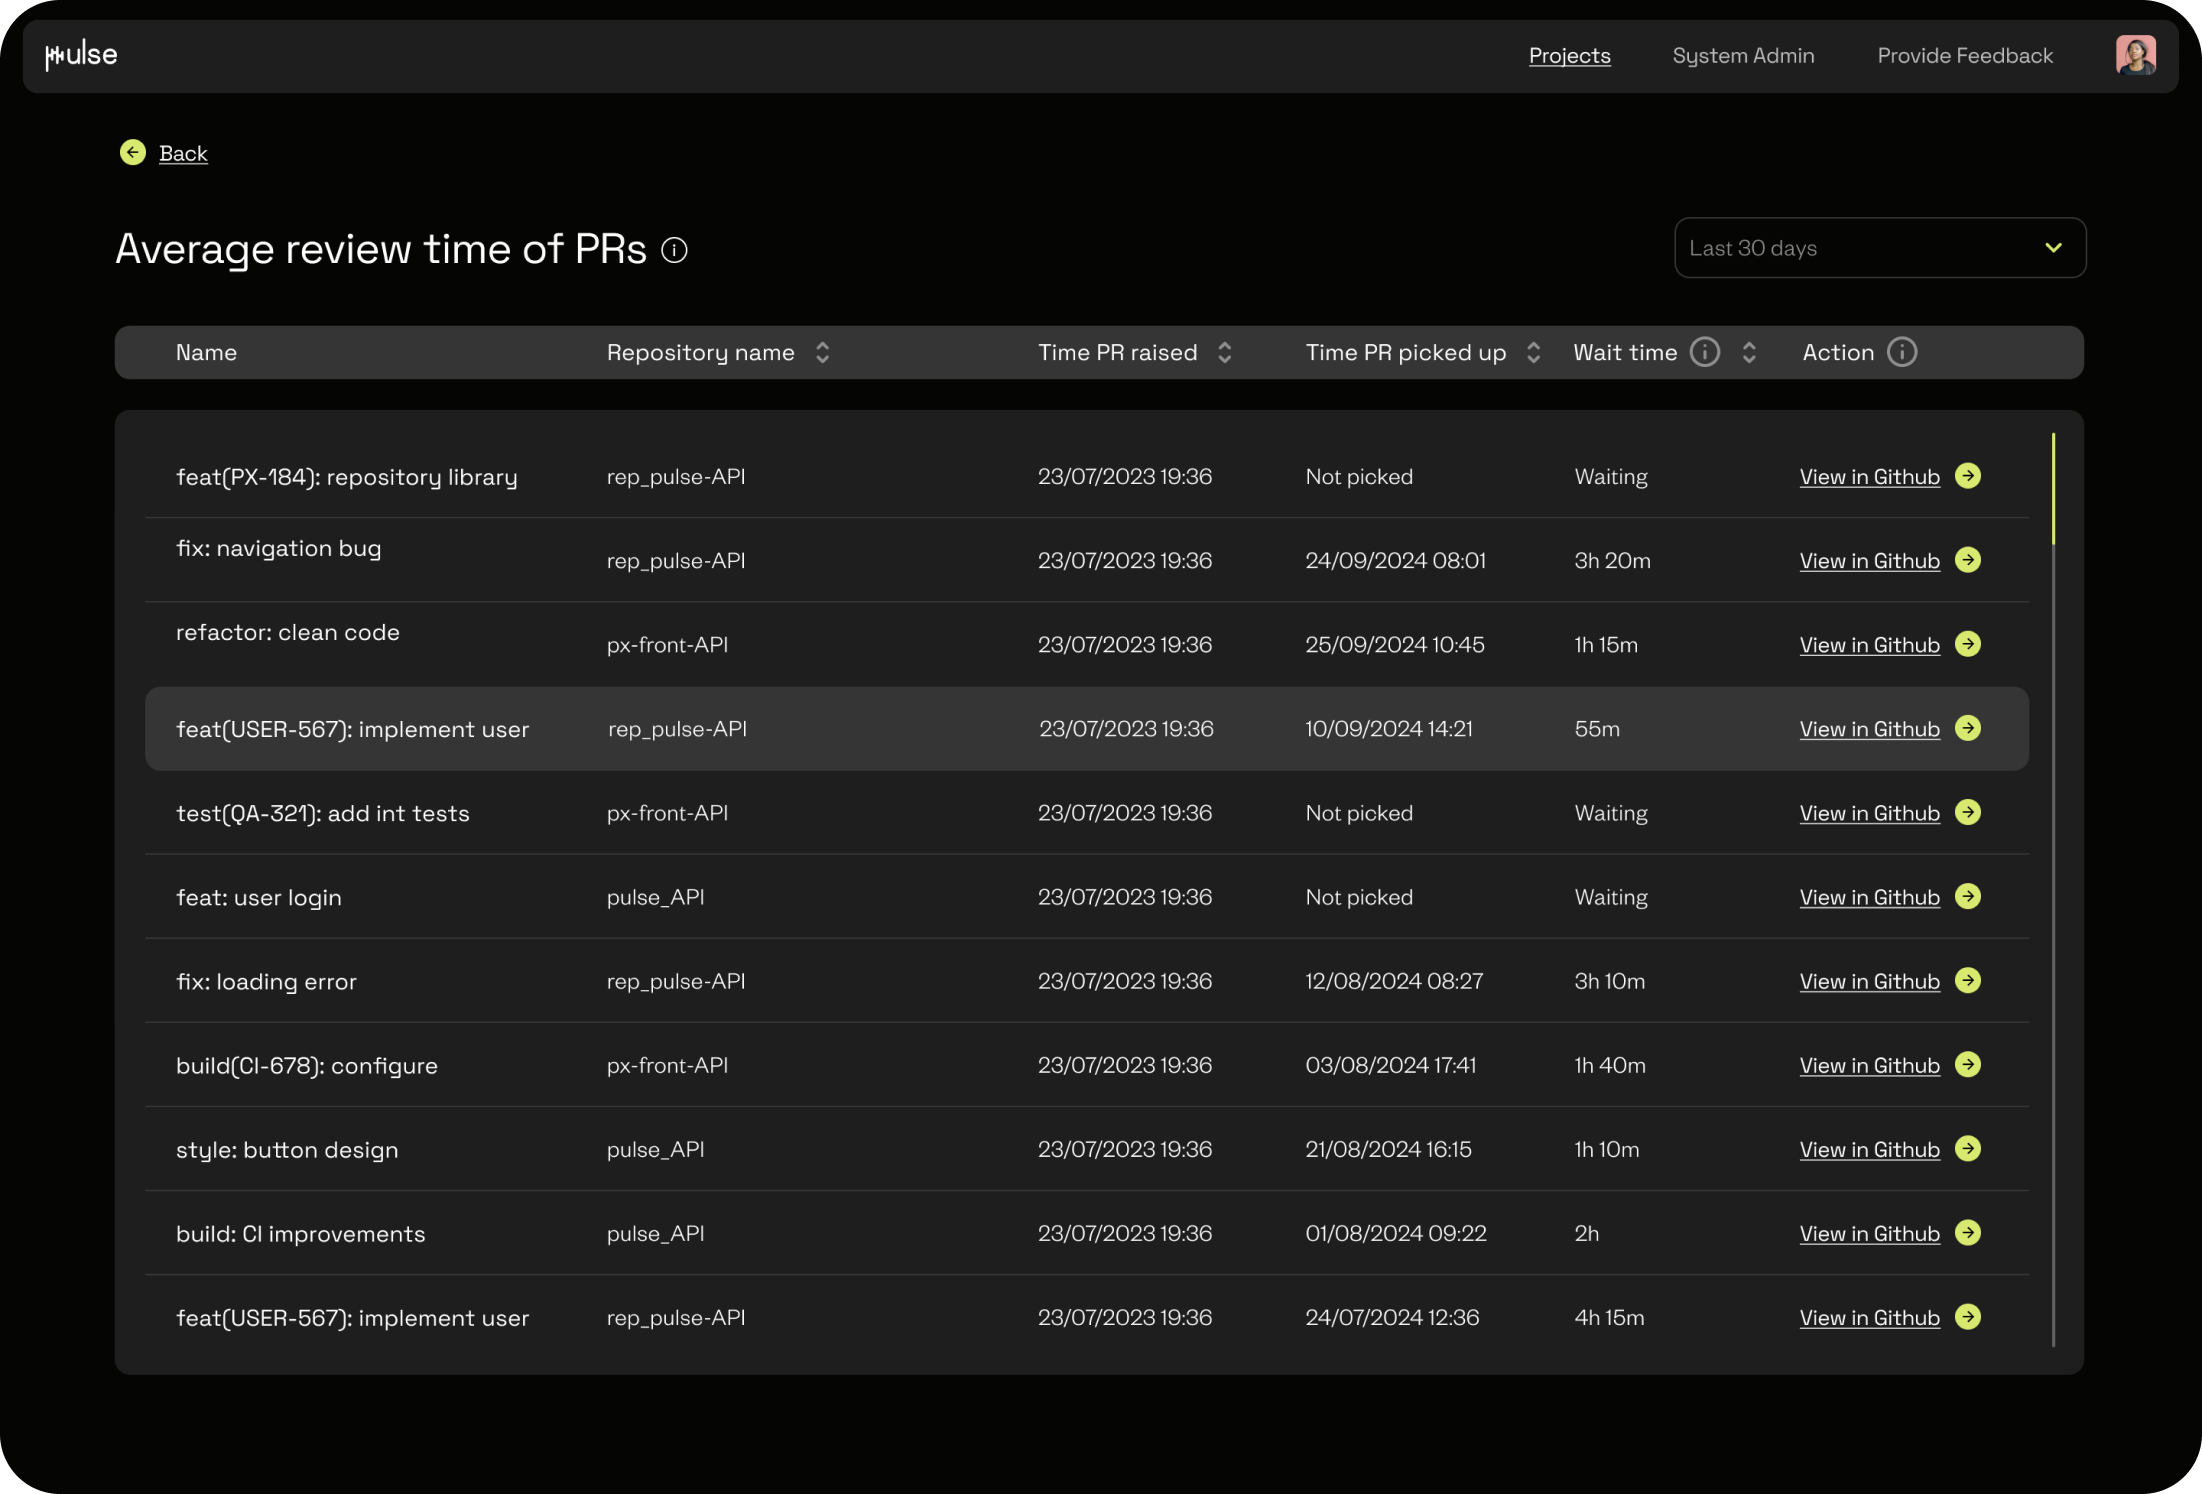
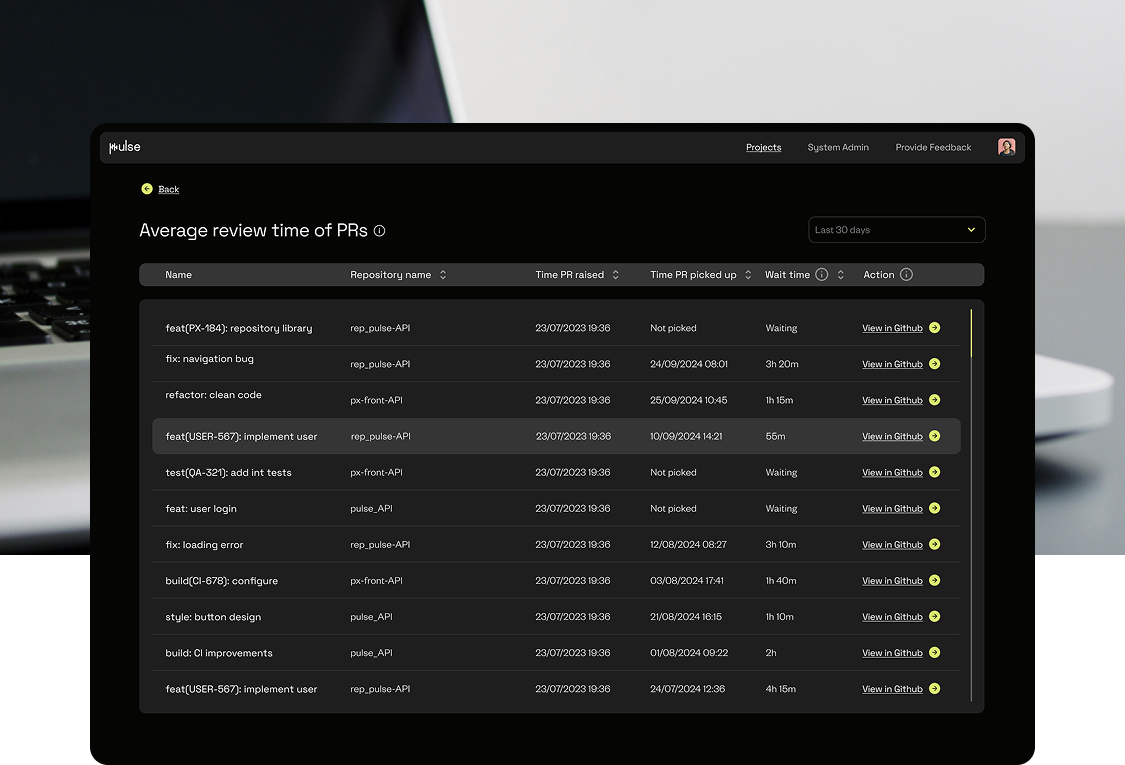
Pulse was built to bring data from tools including Jira and GitHub into a single, easy-to-use interface, giving teams a clearer view of performance across the product development lifecycle.
One of the biggest technical challenges was processing information from different sources consistently, including DAST security scan results, allowing us to understand how quality, throughput, security and efficiency interact.

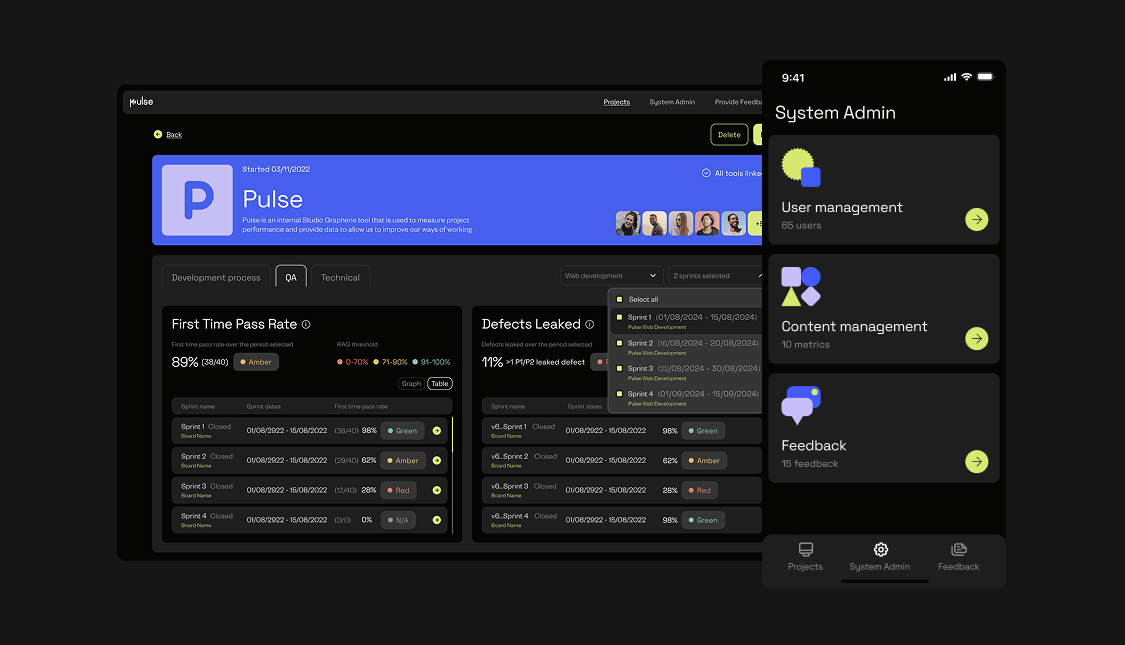
We also made developer experience (DevX) a core part of Pulse. Delivery metrics can show what is happening, but understanding how developers experience the tools, processes and ways of working around them can help explain why.
Pulse combines regular developer feedback with delivery data to identify friction, understand what is helping or hindering teams and highlight opportunities to improve both developer experience and delivery performance.
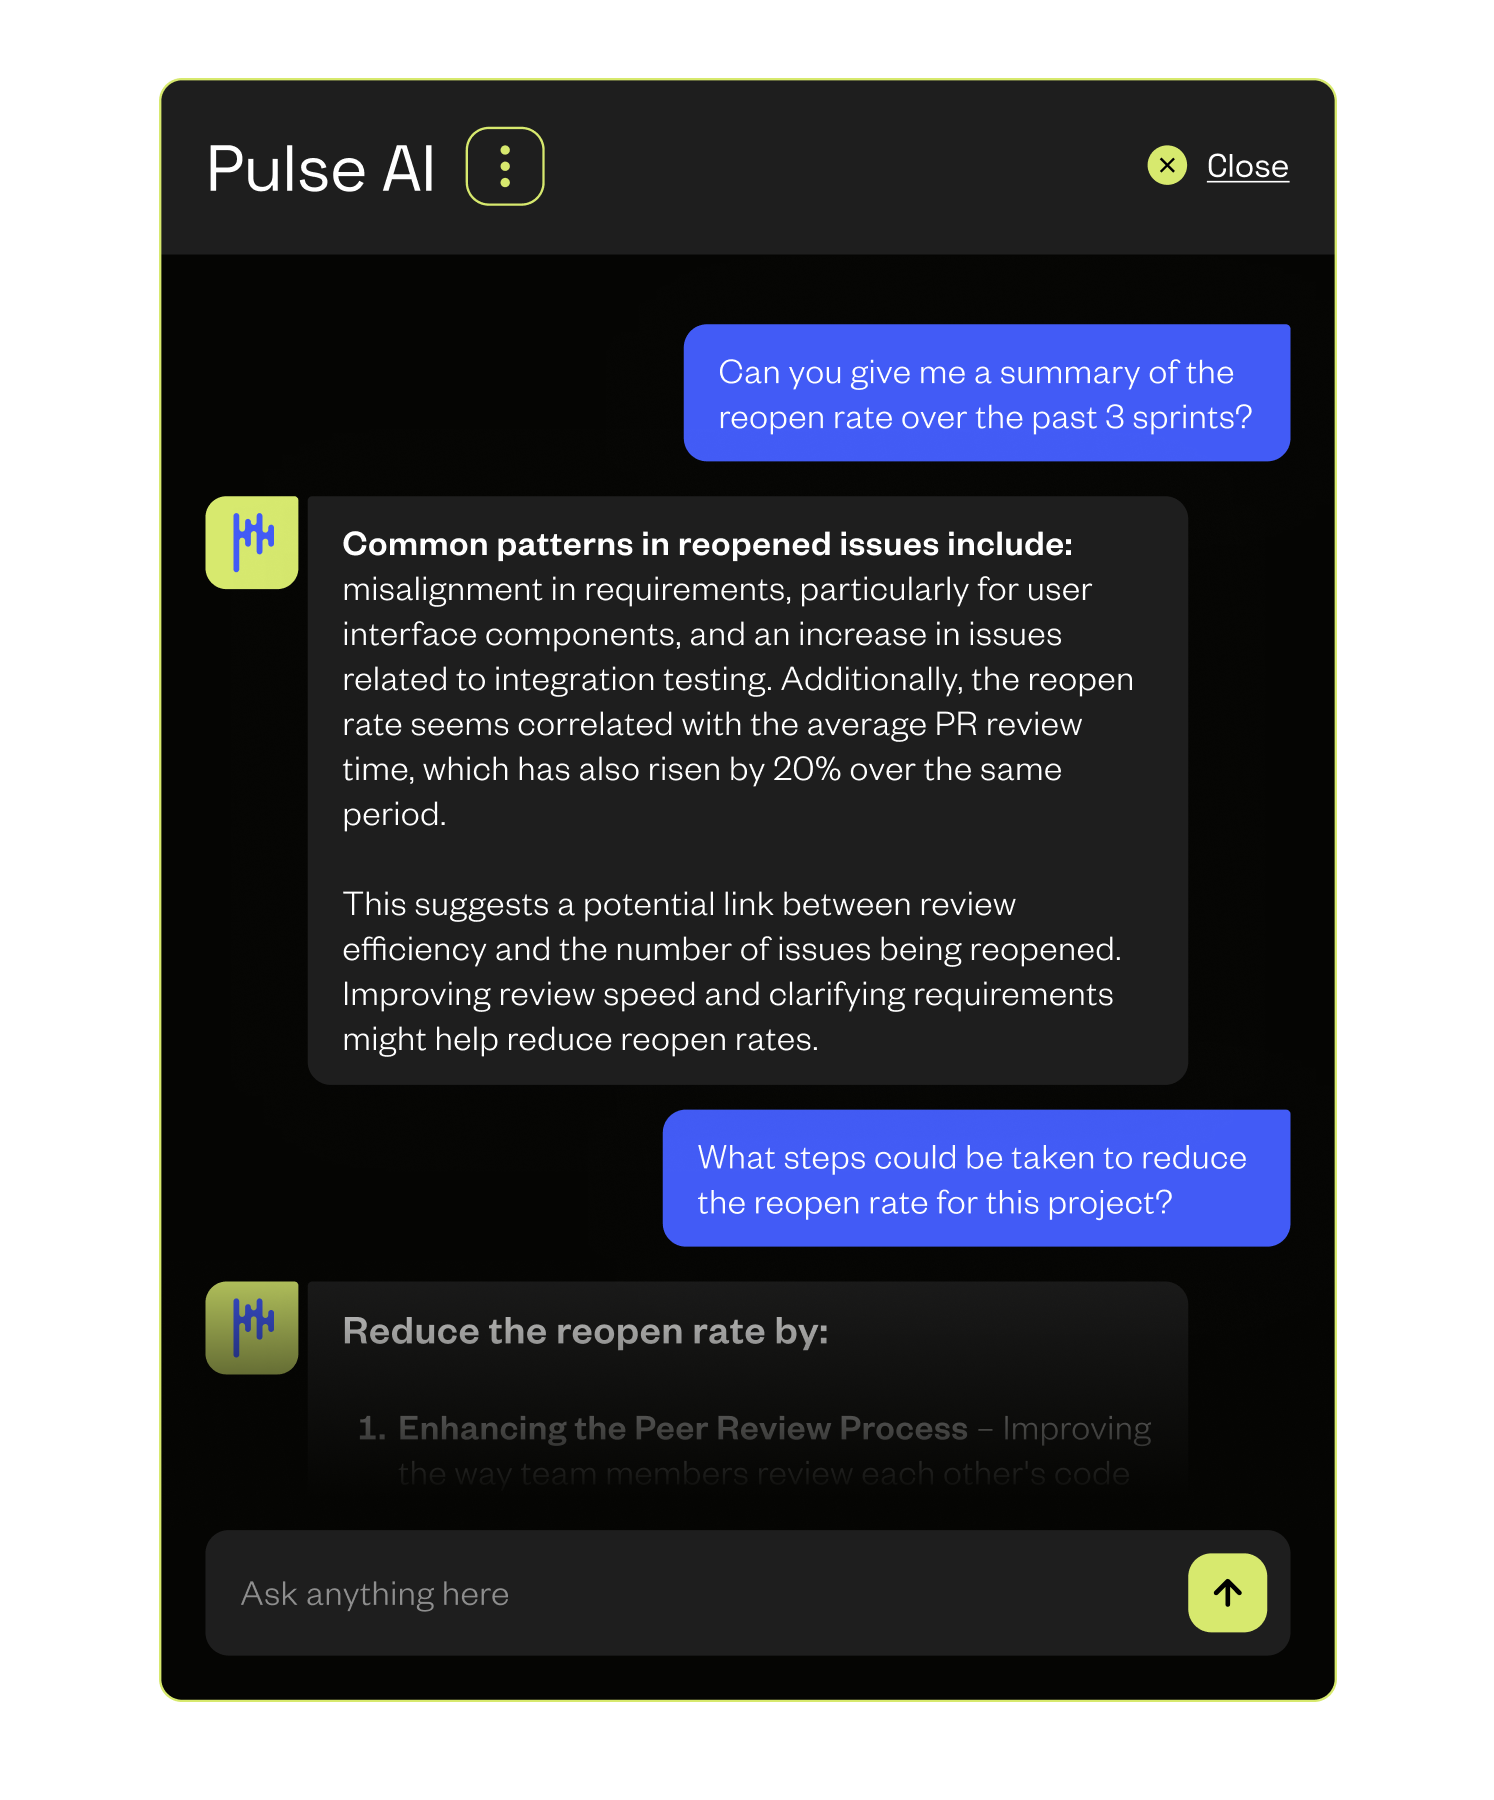
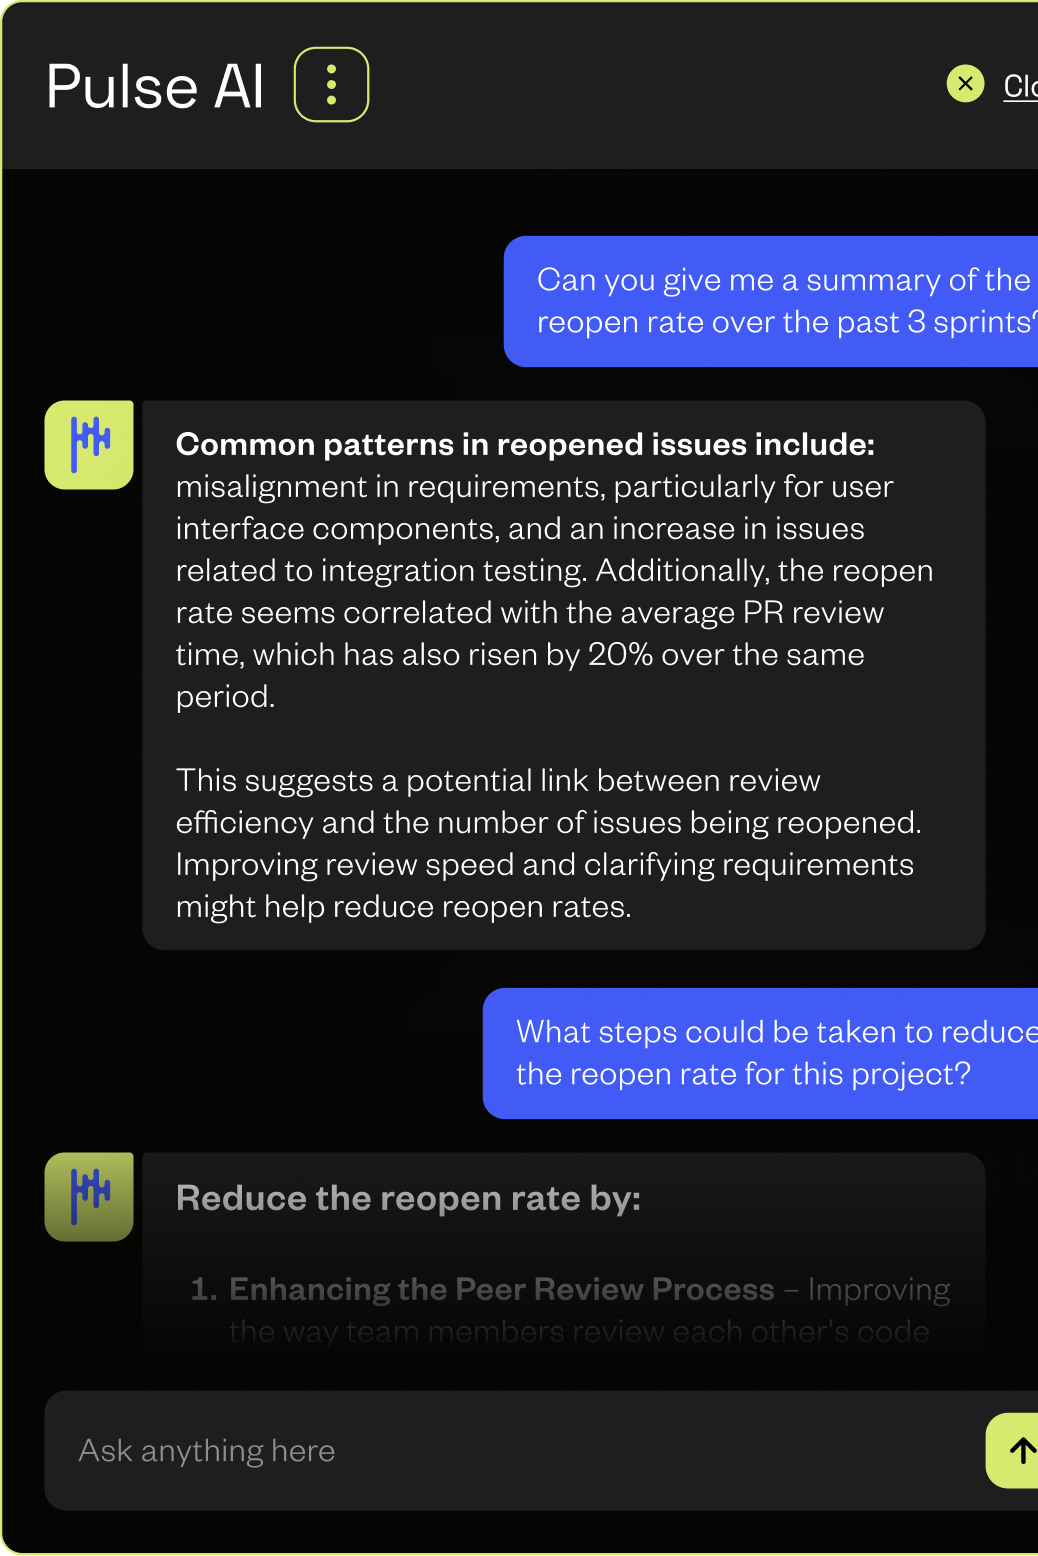
As Pulse evolved, we introduced an AI layer using Model Context Protocol (MCP), connecting Pulse with Claude and allowing teams to have a conversation with their delivery data. Users can ask natural-language questions about project performance, investigate bottlenecks and explore what could be improved, with Claude using the context available through Pulse to surface patterns and opportunities that might otherwise require teams to manually work across multiple dashboards and metrics.
The insights are then used to drive action. When Pulse identifies an issue or opportunity, teams can make targeted changes to workflows, processes or ways of working and measure what happens next. In one project, a Pulse workshop identified estimation accuracy as a priority, alongside improvements to code reviews and QA processes. Across subsequent delivery sprints, average estimation variance fell from 106% to 40%, while overall cycle time reduced by 23%. On another project, targeted actions around development-to-QA handovers and workflow management were followed by a 40% reduction in QA pickup time and a 25% reduction in cycle time.
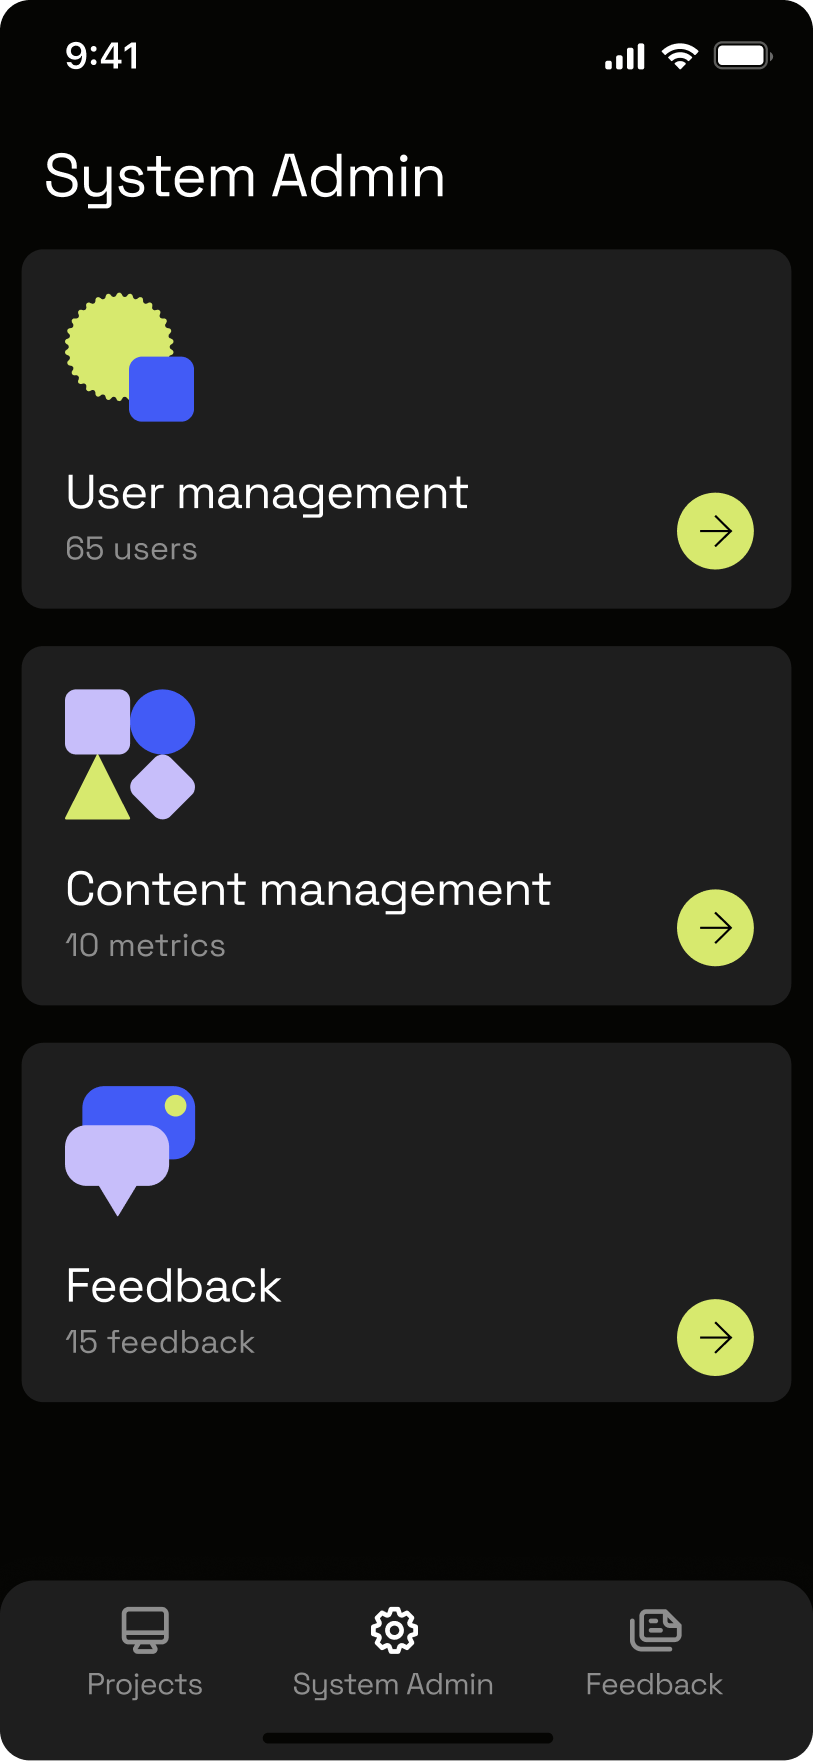
From a product and design perspective, we focused on making delivery data easy to scan: consistent metrics across projects, clear hierarchy and journeys that keep teams in one place instead of switching between tools.
Interviews and workshops with product managers, engineers and QA analysts helped us understand what teams needed from the platform and prioritise the metrics that could have the greatest impact.
We began by analysing data from previous projects to understand which measures provided the clearest signals of delivery performance, from defect reopen rates and peer-review wait times to code quality.
Pulse was built to bring data from tools including Jira and GitHub into a single, easy-to-use interface, giving teams a clearer view of performance across the product development lifecycle. One of the biggest technical challenges was extracting and processing information from different sources consistently, allowing us to look beyond individual metrics and understand how quality, throughput, security and efficiency interact.
We also made developer experience (DevX) a core part of Pulse. Delivery metrics can show what is happening, but understanding how developers experience the tools, processes and ways of working around them can help explain why.
Pulse was built to bring data from tools including Jira and GitHub into a single, easy-to-use interface, giving teams a clearer view of performance across the product development lifecycle.
One of the biggest technical challenges was processing information from different sources consistently, including DAST security scan results, allowing us to understand how quality, throughput, security and efficiency interact.




Results
By combining delivery data, developer experience and AI with the judgement of our teams, Pulse gives us a continuous way to identify opportunities, act on them and measure whether those changes are improving how we deliver digital products.